This is a simplified companion post to Pesticide use in the European Union: the good, the bad and the ugly listed. Compared with the first, more technical post, this one also presents a spatialized map of pesticide use. For most methodological information, the reader is referred to the first post.

Who’s who in pesticide use in the EU
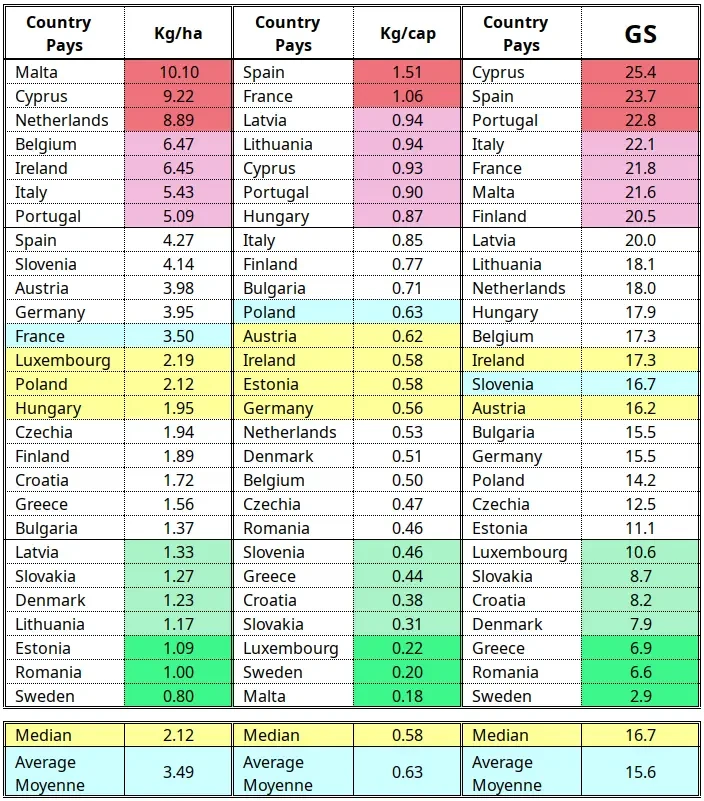
Table 1 lists pesticide1 use in the European Union by decreasing amounts in Kg per ha, the pesticide consumption per capita (Kg/Cap) as well as GS, the “Global Score”. The coding of the variables is such that “high” means “bad”. As the variables often provide contradicting information, the GS was defined as a dimentionless (unitless) indicator to combine several other pesticide-related variables2.

Malta appears as the country that uses most pesticide per ha. It is stressed, however, that the country hardly grows any field crops3 (about 15000 tons of cereals; 95% of the population is urban4) and, as a result the pesticide use patterns differ a lot from what happens in all other countries. The position of Malta as “worst of the worst” is thus not justified. In fact, the country appears last in the per capita consumption in column 2.
If we exclude Malta, the top consumers of agricultural pesticides are thus Cyprus, the Netherlands, Belgium, Ireland, Italy and Portugal. Values are just average in France, the main agricultural exporter in the EU, and especially low in Estonia, Romania and Sweden. Both Sweden and Estonia are minor agricultural countries in the EU context. Estonia seems to be undergoing rapid changes in the area of agriculture, but Romania is a well established major agricultural country, the N. 3 producer in the EU of winter and summer cereals, just below Germany and before Poland. In terms of the reasonable amounts of pesticide used, Romania is the uncontested champion in Europe5.
France and especially Spain have the largest pesticide use per capita, and we find again Portugal and Cyprus at the top. They are thus good candidates for the most chemical-polluted countries in the EU.
At the bottom, we find Luxembourg, Sweden and Malta, but also somewhat surprisingly a group of 4 eastern-central and southern countries: Slovakia, Slovenia, Croatia and Greece.
Before coming back to the Global Score and summing up the post, let us look at a spatially detailed map based on a recent publication by Fiona Tang and others (2021).
Where are the pesticides used?
Tang and her colleagues have embarked on the daring business of mapping pesticide risk at the global scale at a resolution of 5 arc-min, i.e. with a square pixel of somewhat less than 100 km² at the equator6. I said “daring” because most data are modeled rather than observed, starting with cropland Vs.non-cropland, the selection of relevant pesticides, the pathways of pesticides into different environmental compartments and most of all the spatial disaggregation of data which are available for administrative units, sometimes selling points without much information about how the pesticide is used (e.g. number of applications in agriculture). Refer to the document by Galimberti, Dorati, Udias & Pistocchi (2020) in the references to undertand some of the limitations (some of them legal) in terms of data availability and their disaggragation in the EU7. In fact, the paper by Tang et al has two maps addressing the specific issues of data quality and uncertainty, a Data certainty index and a Data quality index. The FAO pesticide datasets are based on annual questionnaires filled in by countries, which mostly require heavy interventions by FAOSTAT to harmonise them and complete time series; see the documents referenced under FAO 2024.
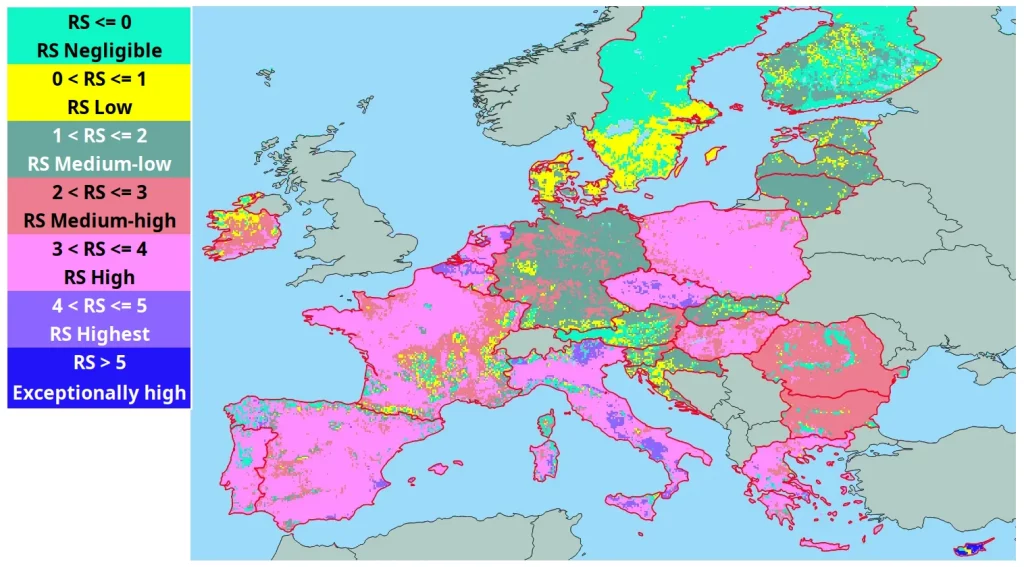
Tang eventually maps out a Risk Score (RS) covering the range from 0 (low) to 6.1 (high). The mapped value8 is the highest among 4 risk scores assigned to risk to soil, risk to surface water, risk to groundwater and risk to atmosphere.

The GS in Table 1 and Figure 1 agree in assigning the worst score to Cyprus9. Countries in the upper quartile in Table 1 (Spain > Portugal > Italy > France > Finland) are mostly classified as high RS in Figure 1, with some very high RS values locally in Spain (Alicante), Italy (Abruzzo, but especially Basilicata and Veneto) but not so in France and in Portugal.
Some of the countries classified as “average” by GS (Netherlands, Belgium, Czechia) appear to display spots of Highest RS, e.g. in Drenthe, Flanders, Středočeský kraj and Jihomoravský kraj.
Medium-High RS corresponds essentially to Romania (lower GS decile) and Bulgaria (close to but below average). There are also large patches in mostly High RS Hungary (e.g. north.east, Észak-Magyarország) and medium-low RS Germany (Parts of Nieder-Sachsen, parts of Rheinland-Pfalz and Nordrhein-Westfalen).
Generally, Medium-low RS scores occur in countries where GS values are average as well, e.g. Germany (GS=15.5) , Austria (GS=16.2) and Slovenia where GS=16.7. This remains true for two Baltic states (Latvia, GS=20.0; Lithuania, GS=Lithuania 18.1). Estonia (GS=11.1) but especially Slovakia (GS=8.7) and Croatia (GS=8.2) are doing better according to GS than to RS.
Very limited pesticide impact is assessed by both GS and RS in Denmark (GS=7.9) and in Sweden (GS=2.9) but the classification of Finland is much worse in terms of GS (20.9) than RS (mostly negligible, some low and about one quarter of the area as Medium-low).
Summary
We have assessed pesticide use and risk in the European union countries according to two independent and rather different approaches: national pesticide statistics from FAO (recapped by “GS indices”) and modeled, spatially explicit data from Tang et al. (2021), recapped by “RS values” (Risk Scores). At the extremes of the impact spectrum the two approaches agree in classifying Cyprus as extremely exposed to pesticides, and Denmark and especially Sweden as doing particularly well. Both approaches also agree in putting Spain, Portugal and France among high risk countries, and Germany as medium-low risk, which is also the result of the GS analysis. There are two large disagreements: (1) Romania is classified among the best performers by GS (GS=6.6) , while RS ranks it somewhere near Bulgaria (RS=15.5) or most of Ireland (RS=17.3); (2) Finland is not far from France for GS (GS=20,5) while Tang map it as RS below 2 and mostly n o risk at all (RS=0).
References
FAO 2024. Pesticides use and trade – 1990–2022. FAOSTAT Analytical Briefs, No. 89. Rome.
https://doi.org/10.4060/cd1486en. https://openknowledge.fao.org/server/api/core/bitstreams/a8a8c2c8-ee36-42e8-a619-7e73c8daf8a6/content. Also consult the Description of the FAOSTAT pesticides dataset.
Galimberti F, C Dorati, A Udias & A Pistocchi 2020 Estimating pesticide use across the EU. Report of the workshop on Estimating pesticide use across the EU: accessible data and gap-filling, JRC Headquarters in BRussels on 9 -10 April 2019. doi:10 .2760/81434. https://op.europa.eu/en/publication-detail/-/publication/120d1fc4-538f-11ea-aece-01aa75ed71a1/language-en
Tang F H M, M Lenzen, A McBratney & F Maggi 2021 Risk of pesticide pollution at the global scale. Nature Geoscience 14:206-210. https://doi.org/10.1038/s41561-021-00712-5. The paper includes generous access to all data. This is not an OpenAccess paper but I can make it available upon request.
Notes
- In the EU, fungicides, bactericides and herbicides make up about 75% of all pesticides, with insecticides reaching about 20%. Other pesticides, including rodenticides, make up less than 10% of total use. ↩︎
- In addition to Kg/ha, Kg/cap and trend in the same variables, GS also includes a variable about the cost of pesticides, which can be interpreted in different ways. It can be read as cost-efficiency of pesticide use, or as how much pesticide consumers are buying when they buy food produced in the EU. Call it “pesticide tax”. You pay for the advertising of your box of cornflakes, and you pay for the pesticide too! ↩︎
- Field crops are herbaceous annual crops grown on large areas for the production of grain, fodder, sugar, fibre, etc. Field crops normally exclude orchard and home garden plants (fruits and vegetables) as well as those grown in greenhouses. Some non-filed crops can occasionally be grown industrially as field crops, e.g. beans or tomatoes. There are also some cases that do not really belong to any of the categories field-garden, i.e nuts or grapes. There’s also the fact that agronomic/botanical categories do not always coincide with statistical ones. For instance, Vietnam categorises white (“Irish”) potatoes as vegetables. ↩︎
- On average, the EU ratio of rural to urban population is almost exactly 1/3. ↩︎
- If taking into account the volume of the production: 23 million tonnes maize and wheat in Romania, just under 3 million tonnes in Sweden, and 4 times less in Estonia. ↩︎
- 5 arc-min pixel size and shape change as follows: (1) at 35° of Latitude (Crete, Cyprus), NS size: 9260 m, EW size: 7485 m, pixel area 70 km²; (2) at 50° of latitude (Brittany, central Germany, south-central Poland), NS: 9260 m, EW: 5952 m, pixel area 55 km²; (3) at 65.5° of latitude (central Finland, southern Iceland), NS: 9260 m, EW: 3840 m, pixel area 36 km². ↩︎
- Refer to figure 7 in Galimbert et al., 2020, for an example of tentative maps of pesticide use for Mancozeb (a fungicide), Thiacloprid (an insecticide) and the infamous Glyphosate, a herbicide. The authors insist that The maps are purely illustrative and not validated. ↩︎
- Here is a quick summary of my reading of the methodology of Tang et al., 2021. They do not directly target human health but aim at assessing the ecological risk in four components of the environment (which they call compartments), namely soil, surface water, groundwater and atmosphere. The authors first selected the 92 most Active Ingredients (AI) in 59 herbicides, 21 insecticides and 19 fungicides. A model was used to determine the concentration of each AI in each 5 arc-minute pixel and each compartment. This concentration is referred to as PEC, Predicted Environmental Concentration. Tang et al. also define PNEC to be the “predicted no-effect concentration” which I assume to mean that the concentration is so low that it is not expected to have any effect. The Risk Quotient is computed as PEC/PNEC which expresses how many times the PEC is larger than the harmless concentration. The Risk point is the sum of all log(risk quotient) of all AIs within an environmental compartment. Eventually, Tang et al thus end up with 4 numbers (Risk points) per pixel and per compartment. The risk score RS is the maximum Risk point among the 4 components.It spans the range from 0 to 6.1 subdivided into categories they refer to as negligible, low, medium and high, as indicated in the legend of figure 2. ↩︎
- In part, the good agreement is due to the fact that Cyprus is a small country. In the larger countries, spots of heavy pollution tend to be diluted by other, more favourable zones. ↩︎