Although they are of paramount strategic importance (or, maybe, because of their strategic importance!) world food stocks are not known. They are mostly estimated indirectly based on other data, with a large error. Among the largest producers of cereals and soybean, some are mainly exporters (Brazil, Argentina, Thailand, Vietnam…), while others (China, India, Indonesia) are also consumers. It can be assumed that the largest stocks are maintained by the latter. Even if guessing food stocks is a perilous exercise, it is interesting to understand where the uncertainties come from…
Introduction
A recent post on “Sweden’s news in English” website, stated that “Sweden’s food reserves are so low they would only last a week in the case of a national emergency.” In contrast, according to various sources such as the five-year global supply and demand projections issued by the International Grains Council (IGC) in January 2017, global food stocks in 2016-17 represent an “all-time peak.” The two contrasting statements point at large differences in national policies, and are just one of the many complexities and uncertainties affecting food stocks. Indeed, while many entities—most countries in the world, FAO, many farmers and traders associations, and numerous institutions funded by governments or professional associations—publish stock data, most information is obtained indirectly and is subject to several sources of errors and uncertainties.
Uncertainties and errors
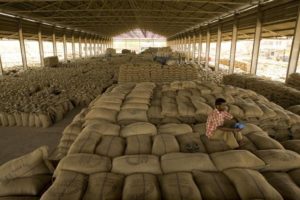
According to David McKee, an international grain consultant, “global reserves of cereals in government hands at any given time could be in the range of 200 to 250 million tons,” which is about half the stored volume of food and represents a minor share of the grain produced annually, an amount currently close to 2500 million tons of maize, wheat, rice, and barley. In many countries, a major uncertainty is the actual location of stored food, which may include household or village stocks in subsistence economies; stocks held by national traders, importers, and exporters or grain producers’ associations; as well as “reserves” held by governments or others as “strategic grain reserves” (SGR).
The concept of SGRs was originally developed in the 1970s to avoid the lengthy process of importing emergency food, as happened during the Sahelian food crises of the 1960s (Lynton-Evans, 1997). They came to renewed attention after the 2008 food price crisis (Prakash, 2011), which also led to initiatives aimed at monitoring and stabilizing food prices, including the Nice Declaration (G20, 2011), mostly in the hope that transparency about food production and stocks would avert future crises (FAO 2011). Things, however, are not so simple, and links between stocks and prices are far from obvious (Gilbert and Morgan 2010, Wright 2012, Kornher and Kalkuhl 2013, Gouel 2014, and Kornher 2015). For instance, a little more than two months ago, the World-Grain website noted that the FAO Food Price Index for January 2017 was 16.4% above its 2016 January level, which is in apparent contradiction with the “all-time peak” of global stocks. Click this link for a collection of expert quotes about prices and stocks.
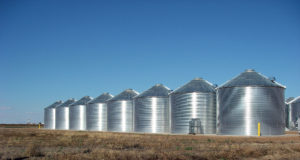
Food can also be stored using a bewildering array of methods (Proctor, 1994). This involves not only cereals and pulses, but also categories of fruits,
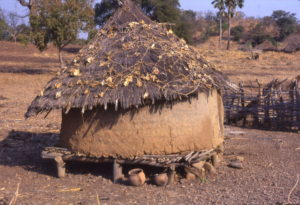
vegetables, roots and tubers, which have in common that they are often eaten fresh, although some of them can also be preserved using traditional techniques (such as air-drying or salting). The technology, which is accessible at village/producer level, can be vastly expanded with modern techniques (for example oven-drying, freezing, or freeze-drying), but these are rarely available in developing countries. A comprehensive account on food stocks should naturally also cover major animal products, the main source of proteins.
In spite of numerous calls for transparency about prices, production, and stocks, the global food stocks —the sum of national stocks—are very imperfectly known and possibly unknowable (Schmidhuber 2015). Many countries, including some major producers, have unreliable stocks data, not only because of actual technical difficulties but also because of their reluctance to disclose information that may be of strategic importance.
Finally, formal food stocks are also expensive to maintain, and countries need to achieve a balance between local production, trade, and stocks in a way that ensures a smooth food supply in cities and rural areas at an acceptable cost. Asian rice-producing and consuming countries are often quoted as having done this using relatively light government interventions and procurements, allowing an efficient private sector to prosper. In Africa, on the other hand, many countries struggle to maintain efficient and cost effective operational stocks even during non-crisis periods (Gilbert 2011). The issue again is somewhat different in the export-oriented countries in the west, in South America (Brazil, Argentina, and Uruguay), and elsewhere (Ukraine, Thailand) where stocks play a minor role in national food security.
It is thus unclear how food stocks are changing. The largest stocks are held by some of the major exporters in North America and Oceania, while Europe, the Mediterranean, and Middle-East maintain small stocks, with the largest countries logically also managing the largest stocks (Laio et al 2016).
Assessment methodologies and methodological issues
Stocks can be assessed based on various techniques. One such method is the use of sampling surveys of stocks, which—in theory—provide useful information in food security assessments, in particular the error affecting estimates as well as the statistical distribution of informal micro-stocks. Surveys, however, are
extremely difficult to carry out and error prone when household stocks are to be included, especially in developing countries (which includes the most populous Asian countries). According to Schmidhuber (2015), who assessed a number of national situations, household surveys systematically underestimate stocks, particularly in the lowest income countries, i.e., in situations where food security issues are most acute.
Importantly, stored foods (and the crops covered in this section) also carry a varying amount of residual moisture, which is normally a temperature and air moisture dependent variable. In a range of 15 to 90% relative humidity (RH), equilibrium grain moisture varies by a factor of 2 to 5 (Hanson, 1985; Rao et al, 2006); it is usually higher in cereal than in more oily seeds. For the mentioned RH range of 15-90%, grain moistures vary from 6 to 20% in maize and barley and from 2 to 13% in legumes such as groundnuts and soybeans. Moisture levels are usually controlled in modern storage but can nevertheless vary and thereby introduce variations in stored amounts; they can correspond to large amounts of food.
FBS methodology
Another methodology to assess food stocks is the use of Food Balance Sheets (FBS), a simple model to assess national food availability using information on national production, imports, and consumption. In the FBS methodology, stocks are estimated at a certain time, T2, using information on (i) the stocks at a previous time T1 and the (ii) change in stocks over the T1 to T2 time frame:
Stock(T2) = Stock(T1) + Delta(T2-T1)
In most cases, T1 to T2 is taken as the marketing year, which may change from country to country. As is clear from the formula above, all absolute errors affecting Stock(T1) are automatically carried over to Stock(T2) . Moreover, the computation of Delta(T2-T1) assumes that the variation is possible and not exceeds the initial stock (Note 1). Next, the change, Delta(T2-T1), is the carry-over and obtained from information about national production, import, export, use, and waste (all expressed in tons), which can be expressed as follows:
Delta(T2-T1) = Prod(T2-T1) +Imp(T2-T1) – Exp(T2-T1) – Use(T2-T1) – Waste(T2-T1)
In this expression, Prod(T2-T1) is the national production during the reference period; Use(T2-T1) the national consumption; Imp(T2-T1) imports; Exp(T2-T1) exports; and Waste(T2-T1) the amount of food that was “lost” or “wasted.” The waste or loss term can be omitted if the equation is rewritten in terms of “net” values of the variables, but that would hide an important aspect of the FBS related to the inefficiency of the food chain. Losses in fact occur at all stages of the food chain, including at harvesting, threshing (if applicable), transport, storage and milling and all forms of processing.
FBS components by crop—production and stocks variability for maize, rice, wheat and soybeans
The components, from production to loss, that influence Delta(T2-T1) all vary at different spatial and time scales (Ben-Ari and Makowski, 2014). Some are more or less periodic, such as Prod(T2-T1), and result from local factors such as weather, while others – such as trade related Imp(T2-T1) and Exp(T2-T1) – relate to socio-economic conditions and demand conditions in the countries that purchase food. Finally, short-term variations (seasonal or annual), which are most relevant for food security planning, come on top of long-term variations that are associated with development, geopolitics, and links with other sectors such as industry. Of all the terms, Use – Use(T2-T1) – is probably the least elastic, at least as far as human consumption is concerned, while domestic production Prod( T2-T1) might be the most variable term.
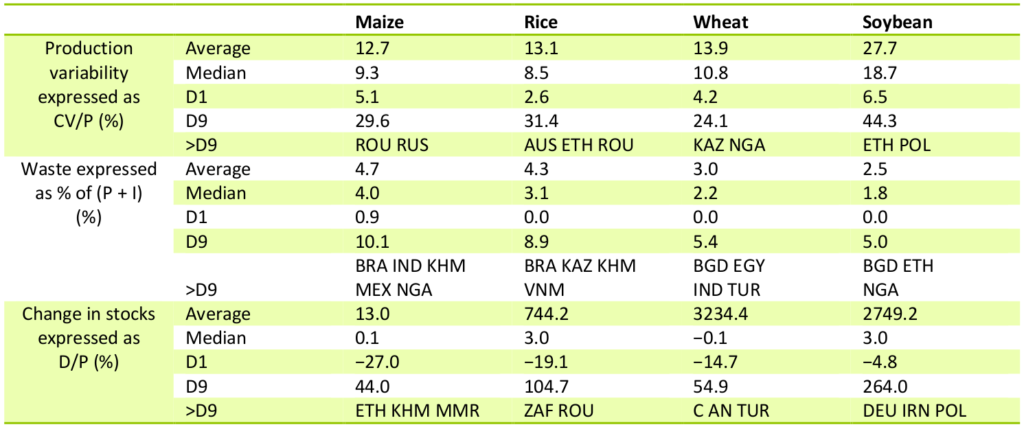
The table below (prepared with data taken from FAOSTAT) lists various statistics, by crop, that relate to stock and production variability, using as the basis for production the concept of “detrended production,” which is preferred to actual production as it excludes the effects of population growth and improved technology (inputs, varieties), as well as the dominant and “random” weather component, as well as one-time factors such as agricultural policy decisions. The table lists details on variation in (i) production (in percentage, with CV/P as the coefficient of variation of detrended production divided by average production), (ii) waste (in percentage, calculated as a percentage of production and imports combined), and (iii) the change in stocks (in percentage, with D/P as the total change in stocks as percentage of the average annual production). As shown in the table, the variability of production is comparable for the cereals (averages of 12 to 14%) but almost double for soybean (Note 2).
For the terms 2 and 3 of the equation, numbers for exports and imports are usually known with fair accuracy, if only because exports mostly originate from well monitored agriculturally advanced sectors in the national economy that are monitored by associations of traders, customs, the ministries of agriculture and transport, and port authorities, among others. As a result, the receiving end, imports, are equally well known.
Next, the quantities of food that fall under the remaining terms of Use and Waste are far less well known. In the FAO FBS, waste appears as an explicit variable, although methods for waste estimation are not explicitly described (note 4). In the table above it is expressed in a percentage of the sum of production and imports, as some crops that appear in the FBS of countries are not produced there but are imported, especially in the case of wheat and soybeans. Waste is in fact one of the most difficult components to assess, as different losses are associated with all the other terms in the equation of ? T2-T1 , including mostly transportation, storage, and processing losses, as already mentioned above. As shown in the table, values for average waste are up to 3% for wheat and soybean (3.0% and 2.5%, respectively) but higher for maize (4.7%) and rice (4.3%). Very low values (rounded to 0) do occur in some countries (refer to the D1statistic in the table) while some others reach values from 5.0% for soybean (for instance in some developing countries such as Bangladesh, Ethiopia, and Nigeria) to more than 10% for maize, even in some major producers such as Brazil, India, and Mexico. It is not clear how the low values can be reconciled with the common opinion expressed in the World Resources Institute blog, according to which “about a third of the planet’s food is lost or wasted, at a global cost of nearly a trillion dollars, with a monstrous environmental footprint including land, water, fertilizer, and greenhouse gas emissions.”
Finally, for the component “Use,” FAOSTAT divides the term into food, animal feeds, seeds, processing, and “other” (which covers mostly non-food uses of food products, such as soap manufacturing from oil or the use of “corn plastic” (See this or this link) .Seed and feed have a larger elasticity than food, while industrial uses, linked to specific industrial processes such as energy production from crop biomass, are less elastic.
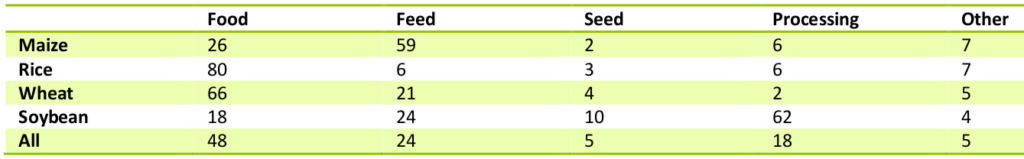
The table above presents the use of food for these varies categories in percentage, showing that food remains the major usage category for wheat and especially rice, while only a fourth of maize is used for human food, mostly in Africa and South America. In North America, as little as 1% of maize is used directly as food (Barton and Clark, 2014). The categories have also been undergoing changes in the last decade, with for example maize and wheat gaining more importance as feed at the expense of food, and even the share of rice as food losing some ground to processing and other uses. Food use of soybean has been increasing 5% in the last ten years, mostly at the expense of processing. Importantly, processing, like waste, is a term that is open to a lot of interpretation. With the exception of food that is consumed “as is” (that is, as harvested), all food is somehow “processed”. FAO itself (FAO, 2015) mentions that “ Codex standards do not provide a definition of processed food in general, and the same kind of operation is considered as “processing” or “manufacturing” for some commodities but not for others”. These open and flexible definitions clearly impact available information, such as presented in the table, about use and changes in use.
Recent changes in food stocks
The D/P variable in the first table above shows the order of magnitude of the 2004-2013 changes in carry-over, or the total change in stocks (ton) divided by average production (ton). Except for maize (+13%), averages are extremely high due to some outliers, so that the median is, again, a more representative statistic. In agreement with the opinion of Laio et al (2016), stocks are, in general terms, stationary, with values close to 0 for maize (+0.1%) and wheat (-0.1%), while they reach +3% for both rice and soybean. Some high values do occur among minor producers of the various commodities.
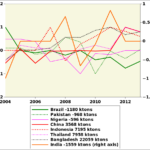
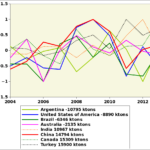
Recent inter-annual variations are shown in the figures below for the countries that recorded the largest stock changes between 2004 and 2013, according to the FBS calculations.
Maize
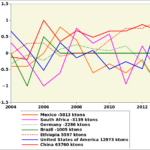
For maize, negative changes occurred mainly in Mexico (one of the main producers), South Africa, Germany, and Brazil (one of the top exporters); in Brazil, a large drop in 2005 (-2 million tons) was brought about by low production compared with previous years, which was however compensated by a partial recovery in 2006 and a remarkable stability since then. The largest decrease in stocks was recorded for Mexico, a trend starting in 2007. Since 2007, China has been constantly increasing maize stocks—by as much as 64 million tons, partly through imports from the United States where the maize stock increase is the second largest after China (about 13 million tons), most of which was accumulated in 2013, which constituted the beginning of the current “all time high” of just below 60 million tons in 2016 according to the National Corn Growers Association. After the 2008 food crop price crisis, Ethiopia has been constantly increasing stocks.
Rice
A similar constant growth of stocks over the ten years to 2013 occurred for rice in Bangladesh, leading to a total increase of 22 million ton, one of the largest among the top producers. The next largest increases in rice stocks vary from about 3 million tons in China to about 8 million tons in Indonesia and
Thailand, a top exporter of the commodity. Pakistan and India, two other major exporters, are characterized by large inter-annual variations of stocks summing up to negative values between 1 million ton (Pakistan) and 1.5 million ton (India).
Wheat
The largest wheat stock decreases from 2004 occurred among three of the major exporters (Argentina, -11 million tons; United States, -9 million tons; and Australia, -2 million tons) and in Brazil (-6 million tons), all with marked inter-annual fluctuations. With the exception of Turkey, similar fluctuations affected countries where stocks increased (India, China, Canada, all above 10 million tons) among which only Canada is a major exporter (+15 million tons). In Turkey, the largest absolute increase up to 2013 (just under 16 million tons) was achieved more gradually.
Soybeans
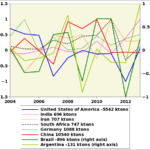
The United States, Brazil, and Argentina—the major exporters of soybean—differ in the relation of the crop to their national agricultural landscape. While the Latin American countries produce about as much cereals as soybean, the United States produces four times more cereals. About 40% and 45% of the national production is meant for export in the United States and Brazil respectively, while the share is less (21%) in Argentina. In comparison to cereals, the largest stock changes in soybean are small, indicating generally small stocks among the three major producers: changes remain below the 1 million ton line in Brazil and Argentina (both negative), and about 5.5 million tons (also negative) in the United States. In China, the major global importer, the overall change is positive (+10 million tons) was achieved through imports.
Conclusions
With few exceptions, food stocks at all scales (village to national to global levels) are known only with a very large uncertainty. Variations can, to some extent, be assessed based on the food balance sheet accounting approach. Except for exports and imports and, to a lesser extent production, the uncertainties affect every single term used to compute stock changes, resulting in even larger errors when they are summed. In part, the uncertainty also derives from definitions. Altogether, when account is taken of demand (that is, mostly population-driven changes at the ten-year time scale considered here), global stocks can generally be considered stationary, even if large differences do occur according to year and country. With the possible exception of wheat, no clear effect of the 2008 food price crisis is visible in stocks changes, which seem to be as production-driven (that is, weather-driven) as usual.
Notes
Note 1: If this should happen, Delta(T2-T1) would be equivalent to the available stock, and no food would be in stock at the end of the period. While the situation does undoubtedly occur in extreme cases of widespread famine, the FBS provides no certainty about its occurrence when computed over large areas.
Note 2: Averages are larger than the corresponding median values because among the major producers of cereals and soybean production some countries are characterized by unusually large production variability. Weather and geopolitics seem to play a dominant part.
Note 3: The “major producers” are the countries that, together, make up 80% of the world production. CV=coefficient of variation of detrended production; P=average production (tons); I=imports (tons); D= change in stocks (tons); CV/P is the coefficient of variation (CV) of detrended production divided by average production, i.e., the standard deviation of departures of production from the trend line (tons) divided by the average production (tons) times 100, in percentage; Waste (in %) is expressed as the percentage of (production + imports), both in tons; D/P represents the total change in stocks (tons) in percentage of the average annual production (tons). The “total change in stocks” is the sum of all annual changes between 2004 and 2013; D1: lower decile of variable; D9, upper decile; >D9 lists countries that exceed the upper decile, with countries identified by their three letter ISO codes.
Note 4: FAO is far from explicit about how waste is estimated (refer to the FAOSTAT definitions, including FAO 1986, a document that could not be located in the FAO document repository.
Note 5: The eight included countries are those with the largest stock changes between 2004 and 2013 (4 positive values and 4 negative ones). Values are normalized so that for each individual country the ordinates are in direct proportion of actual changes, the total value of which is shown after the name of the country in the legend. For the USA, China and Brazil, the same colour is retained in all the graphs: blue, red and green, respectively.
References
Barton B and S E Clark 2014 Water & climate risks facing U.S. corn production. How companies & investors can cultivate sustainability. A Ceres Report. Boston, USA. 71 pp.
Ben-Ari T and D Makowski 2014 Decomposing global crop yield variability. Environ. Res. Lett. 9 114011
Carr J A, P D’Odorico, S Suweis, D A Seekell 2016 What commodities and countries impact inequality in the global food system? Environ. Res. Lett. 11:095013
DMK 2014 chapter http://www.davidmckee.org/2014/03/20/government-global-grain-reserves/
FAO 1986. The ICS users’ manual. Interlinked computer storage and processing system of food and agricultural commodity data. Rome, Italy.
FAO 2011, Policy options to address price volatility and high prices, in : The state of food insecurity in the world 2011. FAO, Rome, Italy. http://www.fao.org/docrep/014/i2330e/i2330e.pdf
FAO 2015. Guidelines on the collection of information on food processing through food consumption surveys. FAO, Rome, Italy.
G20 2011 Cannes summit final declaration “building our common future: renewed collective action for the benefit of all” http://worldjpn.grips.ac.jp/documents/texts/G20/20111104.D2E.html
Gilbert C L 2011 Food Reserves in Developing Countries: Trade Policy Options for Improved Food Security. International Centre for Trade and Sustainable Development (ICTSD) Issue Paper N.37. Geneva, Switzerland
Gilbert C L, C W Morgan 2010 Review Food price volatility. Phil. Trans. R. Soc. B 365:3023-3034
Gouel C 2014 Food Price Volatility and Domestic Stabilization Policies in Developing Countries. National Bureau of Economic Research (NBER) Working Paper series, Paper 18934, Cambridge (MA), USA. https://www.nber.org/papers/w18934.pdf
Hanson J 1985 Procedures for Handling Seeds in Genebanks, IBPGR, Practical manuals for genebanks N. 1. Bioversity international. Rome, Italy.
IATP 2012 Grain Reserves and the Food Price Crisis: Selected Writings from 2008–2012
Institute for Agriculture and Trade Policy. Institute for agriculture and trade policy, Minneapolis (MI), USA. http://www19.iadb.org/intal/intalcdi/PE/2012/10324.pdf http://www19.iadb.org/intal/intalcdi/PE/2012/10324.pdf http://www19.iadb.org/intal/intalcdi/PE/2012/10324.pdf
Kornher L 2015 Food price volatility: the role of stocks and trade. Zentrum für Entwicklungsforschung, Rheinische Friedrich-Wilhelms-Universität, Bonn. hss.ulb.uni-bonn.de/2015/4121/4121.pdf
Kornher L, M Kalkuhl 2013 Food price volatility in developing countries and its determinants. Zentrum für Entwicklungsforschung, Universität Bonn http://ageconsearch.tind.io//bitstream/156132/2/B4-Kornher-Food_c.pdf
Laio F, L Ridolfi, P D’Odorico 2016 The past and future of food stocks. Environ. Res. Lett. 11:1748-9326.
Lynton-Evans J 1997 Strategic grain reserves – Guidelines for their establishment, management and operation. FAO Agricultural Services Bulletin N.126, FAO, Rome, Italy.
Marchand P, J A Carr, J Dell’Angelo, M Fader, J A Gephart, M Kummu, N R Magliocca, M Porkka, M J Puma, Z Ratajczak 2016 Reserves and trade jointly determine exposure to food supply shocks Environ. Res. Lett. 11:095009
Prakash A (Ed) 2011 Safeguarding food security in volatile global markets. FAO, Rome, Italy. http://www.fao.org/docrep/013/i2107e/i2107e25.pdf
Proctor D L (Ed) 1994 Grain storage techniques, evolution and trends in developing countries. FAO agricultural services bulletin N. 109. FAO and GASCA, Rome, Italy.
Rao N K, J Hanson, M E Dulloo, K Ghosh, D Nowell, M Larinde 2006 Manual of Seed Handling in Genebanks. Handbooks for Genebanks N. 8. Bioversity international with ILRI, FAO and CTA. Rome, Italy.
Sarris A Food Security Stocks and Emergency Reserves from a European Union CAP Perspective Vestnik of Saint-Peterburg University. Series 5 ECONOMICS Issue 1, 2015 pp. 37-68
Schmidhuber J 2015 Comparing and reconciling food consumption from household surveys and food balance sheets, FAO/Statistics Division. Beijing, AMIS workshop, July 2015
Seekell D, J Carr, J Dell’Angelo, P D’Odorico, M Fader, J Gephart, M Kummu, N Magliocca, M Porkka, M Puma 2017 Resilience in the global food system. Environ. Res. Lett. 12:025010
USDA 2017 World Agricultural Supply and Demand Estimates. https://www.usda.gov/oce/commodity/wasde/latest.pdf
Wright B D 2012 International grain reserves and other instruments to address volatility in grain markets http://libcatalog.cimmyt.org/download/reprints/97072.pdf