This chapter attempts to put the locations the spouses originated from in the broader historical context of “Germany” and of “Europe” between 1800 and 1935, as it is clear that most people who married between Hallschlag, Virneburg and Mehring were “Germans” who came from areas that were part of the “Germany” of the time.
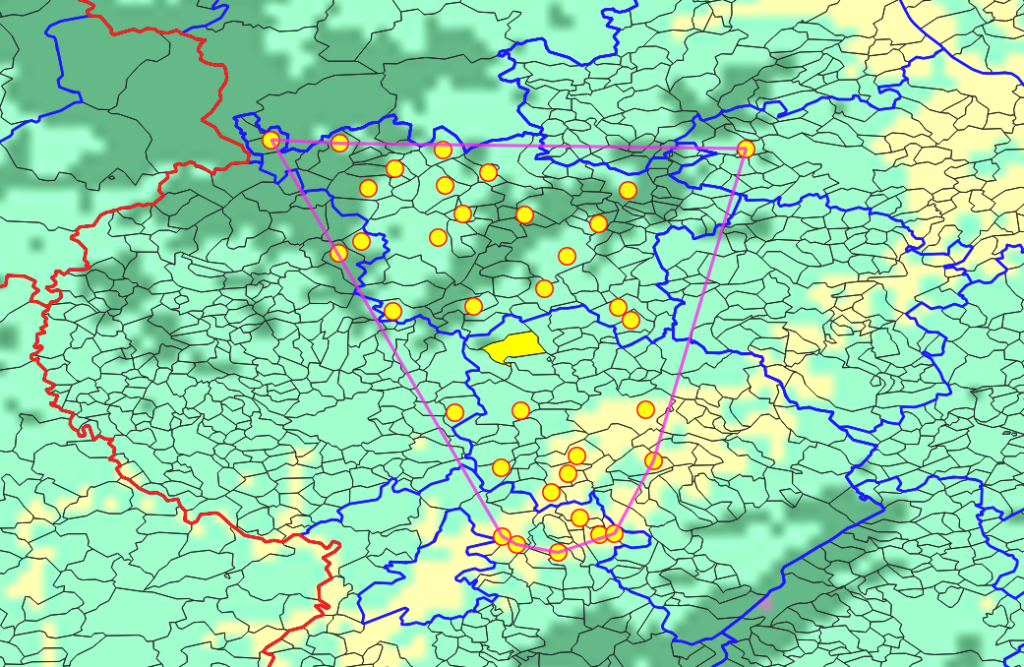
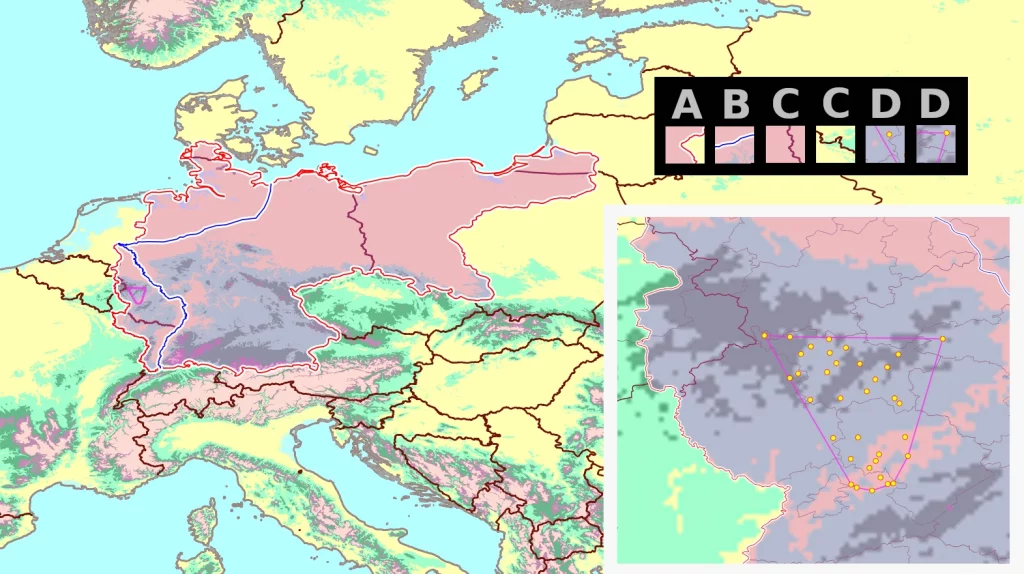
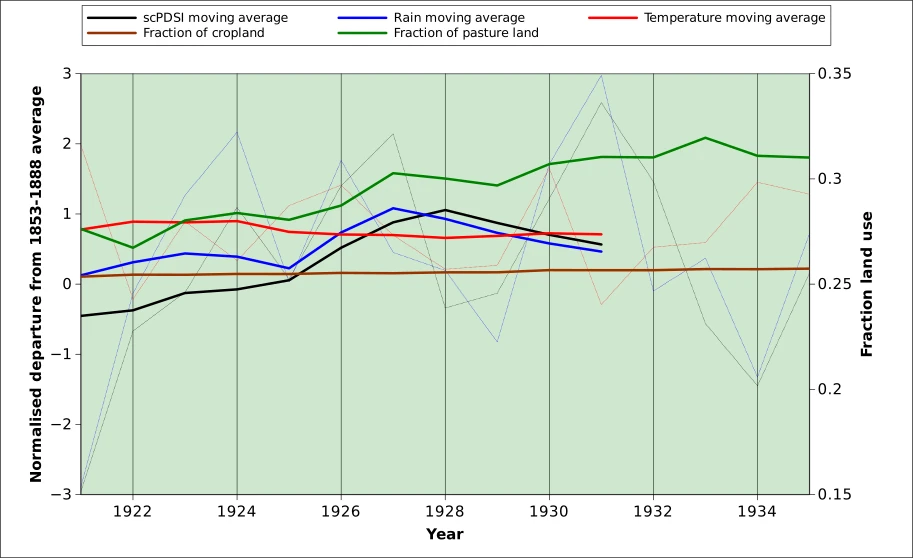
The chapter makes extensive use of the “Project hull”, a convex polygon enclosing all 35 wedding places in the database (figure below). The centre of the hull (refer to the legend of the figure) will be used in subsequent sections to compute distances.
I don’t want to venture to define what is meant by “Germany” (hence the quotation marks). At first sight, it is a territory that corresponds more or less to the regions where German is the lingua franca. The term “German language” itself is open to various interpretations, more or less strict. For example, Luxembourgish is a Germanic language, even if its lexical fund includes more and more French words. Dutch? It is quite easy to understand by a German from the Eifel, especially if she speaks a dialect. The internet has this interesting map of German-speaking lands. It is of obscure origin but nevertheless rather interesting1.
My point is thus that the brides and grooms covered by this project, even if they come from far away (or return, maybe a generation after their parents left!), remain culturally close (e.g. German names dominate). It happens that the borders of “Germany” were quite mobile during the period under consideration from 1800 to 1935. These political changes have affected the lives of ordinary people, and we will see in subsequent chapters that some variables change with politics!
It is also stressed that there has been a regular flow of Germans to the west (mostly in the 1800s) and to the east (mostly during the 1700s). This second movement (which was the first chronologically) led to Estonia and Latvia, central Poland, Galicia (Red Ruthenia and Lesser Poland), Volhynia (southeastern Poland, southwestern Belarus, and western Ukraine), and around the northern half of the Black Sea, from the Danube delta across Moldova, southern Ukraine (including Crimea) and the northern Caucasus (Russia) to Georgia and Armenia.
To some extent, the borders changes have been following the people and people have also taken advantage of the changing borders, even short-lived ones like those of Napoleonic Germany.
It became clear to me during this work that at least some description of political changes between 1800 and 1935 would help to understand some of the results. This is covered in the present chapter. I had difficulties finding georeferenced historical maps at the appropriate scale and had to resort to georeference images, which explains the fuzzy look of some maps below.
The years in the data base are grouped into 1800-1935 period is subdivided into five standard periods:
HIST-1. The end of the Ancien régime (… 1805)
The period in practice includes just the beginning of the KJT record (i.e. 1800) to 1805, which is the basis of the present work.
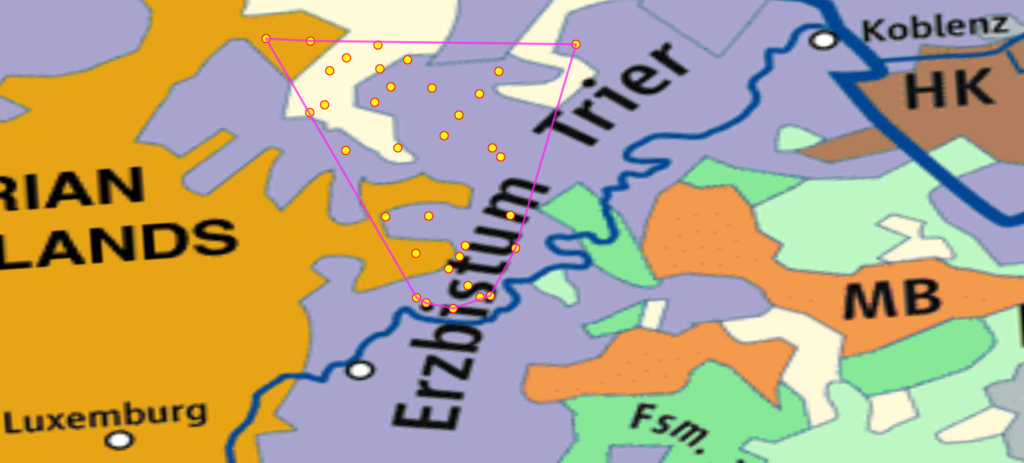
“Germany” was very divided politically in the formally still extant Holy Roman Empire. Population was heavily rural, with just 2% living in cities. The Localities of the project were mostly part of the Roman Catholic Archbishopric of Trier (Erzbistum Trier). Neighbouring territories include the Austrian Netherlands (West) and a cloud of micro-territories to the est, including the Margraviate of Baden-Baden (Markgrafschaft Baden-Baden) and Palatine Zweibrücken (Fürstentum Zweibrücken, abbreviated as Fsm. Zweibrücken) . The largest and least fragmented members of “Germany” included the Kingdom of Bohemia and the Electorates of Bavaria and Saxony. The territory included in the Project hull was first occupied by France in 1794, and eventually formally incorporated into the country in 1798.
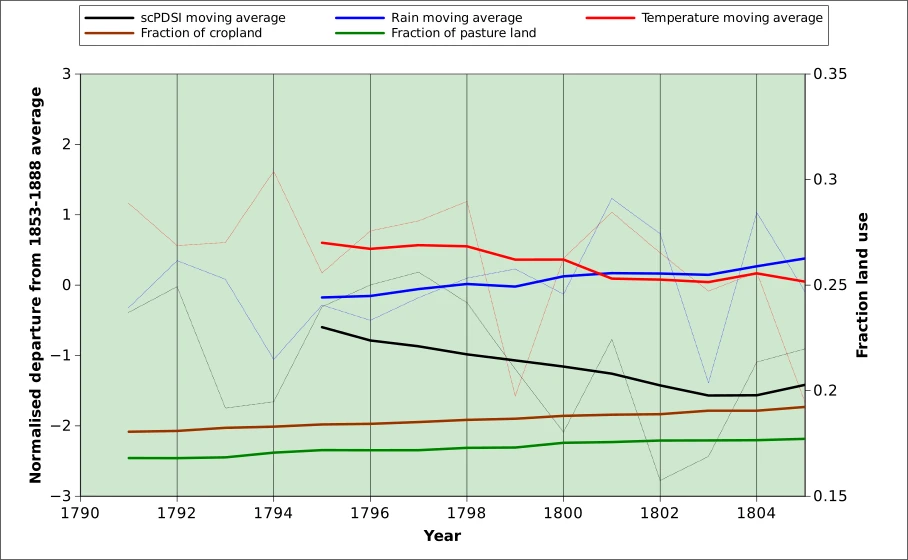
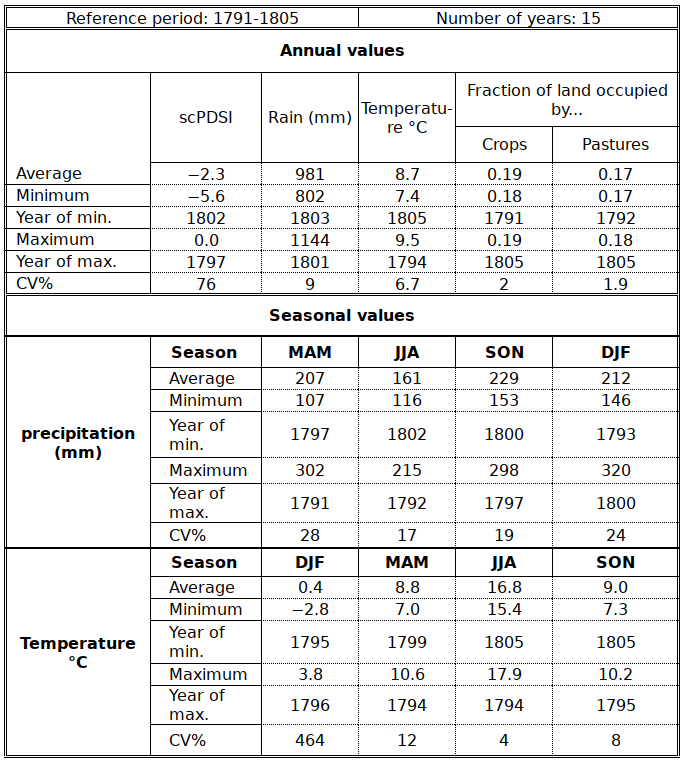
Although the years retained for the weddings database start in 1800, it was decided to include the years 1791 to 1799 in the environmental variable statistics in order to add some significance (analyses based on too small samples are not very meaningful).
The period experienced relatively average conditions but 1802 and 1803 were relatively wet years, according to the scPDSI indicator. scDPSI values were more variable (CV=76%) than those of temperature or precipitation (less than 10%). It is also observed that seasonal variables are, logically, more variable than annual ones. The largest interannual fluctuations occurred between winters, which may be the factor behind the large variability of scPDSI. It is stressed that the CV% does not provide a very useful measure of variation when the average is close to 0! The difference between the minimum and the maximum may be a more useful indicator in this case: it reaches 6.6 °C while it does not exceed 3.6 °C (during spring) in other seasons.
HIST-2. Confederation of the Rhine (Rheinische Bundesstaaten, informally known as Rheinbund); 1806-1813
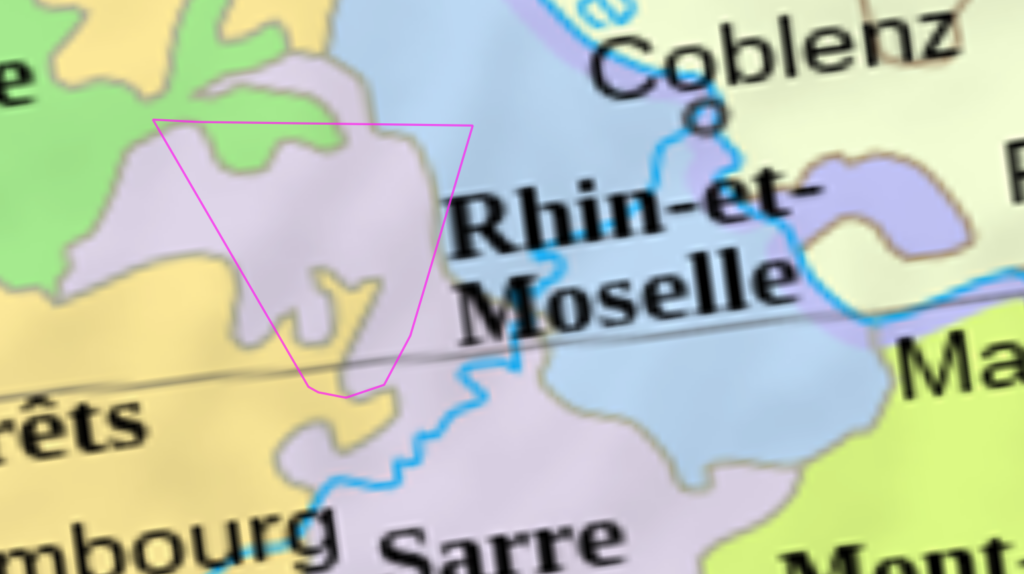
This is the period of Napoleonic Germany, with the Rhine as the eastern border of France. As a result, all localities inside the hull were part of France. Several new Départements had to be established in Germany, Belgium and the Netherlands. Virneburg was part of the Département Rhin-et-Moselle, while the bulk of the others belonged to Département de la Sarre (with Daun, Gerolstein, Lissendorf and Stadtkyll as minor administrative centres). The events of Napoleonic France, in particular the mobilizations, played a very visible role in the marriage rates.
“Germany” itself (east of the Rhine, know as Confederation of the Rhine) was relatively similar to present-day Germany but it was ruled with the more or less explicit dominance of France (Satellite states). The Confederation also included parts of western Austria (Salzburg, Innsbrück) but did not comprise parts of Brandenburg (Berlin, which belonged to Prussia), Lower Saxony, Schleswig-Holstein and Baden-Würtemberg.
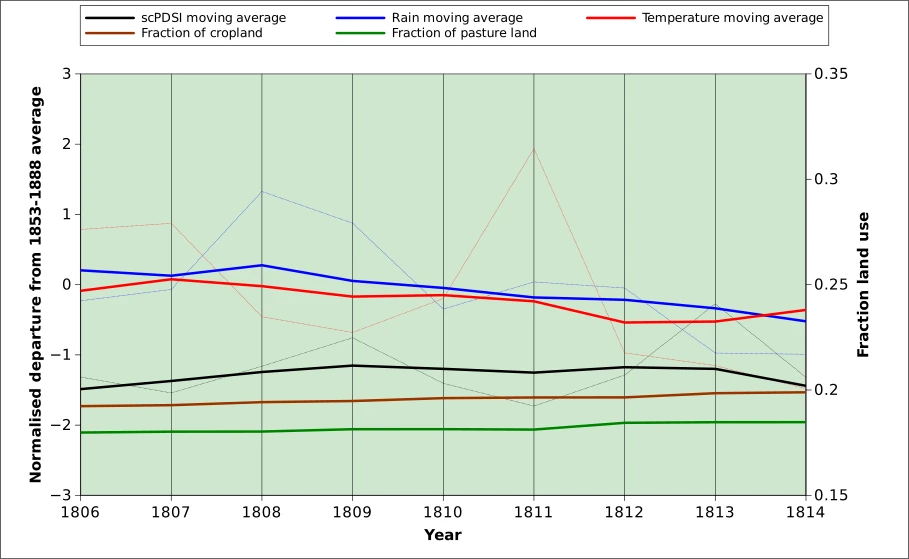
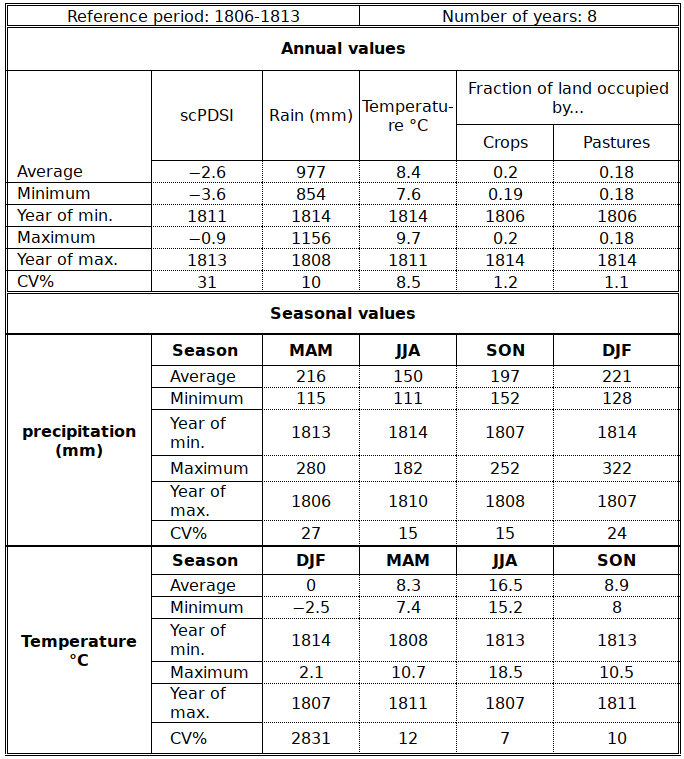
Environmental conditions were remarkably similar to those recorded during the previous period, even if generaly less variable.
The observation made above about winter CV% of temperature holds here as well. The difference between the winter temperatures of the coldest season (1814) and that of the warmest winter (1807) reaches 4.5 °C.
The warmest year (1811) results from high spring temperature (3.4 °C warmer than the average of the other years). The wettest year (1808) is the result of summer precipitation.
The transition period of 1814
1814 was the period when Napoleon was banished to Elba prior to his attempted come-back in early 1815 and his eventual and definitive removal from European history during mid 1815. 1814-15 are also the years of the Congress of Vienna: it took time for the victors of Napoleon to “optimize” Europe. In many tables in other parts of this Project, 1814 was included for statistical purposes both with the Confederation of the Rhine and wìth the German Confederation.
Climatically, 1814 was dry (dry winter conditions at the end of the year)
HIST-3. German confederation (Deutscher Bund); 1815-1866
The German confederation was a relatively loose political arrangement including the areas which were to be part of the German empire with the exception of the southern States. It marks, however, the beginning of the dominance of Prussia, including its Rhine province (Rheinprovinz, Provinz Rheinland, Rheinpreußen and Rheinlande) which somehow survived from 1822 to 1922 or even 1946. It’ s borders underwent several changes over its more than hundred years of existence, but the Hull was completely included in the Rhine province throughout.
Many economic improvements took place during the period, e.g. the agricultural areas expanded 40%. The combination of high birth rates and decreased death rates led to rapid population growth (+60% over the period).
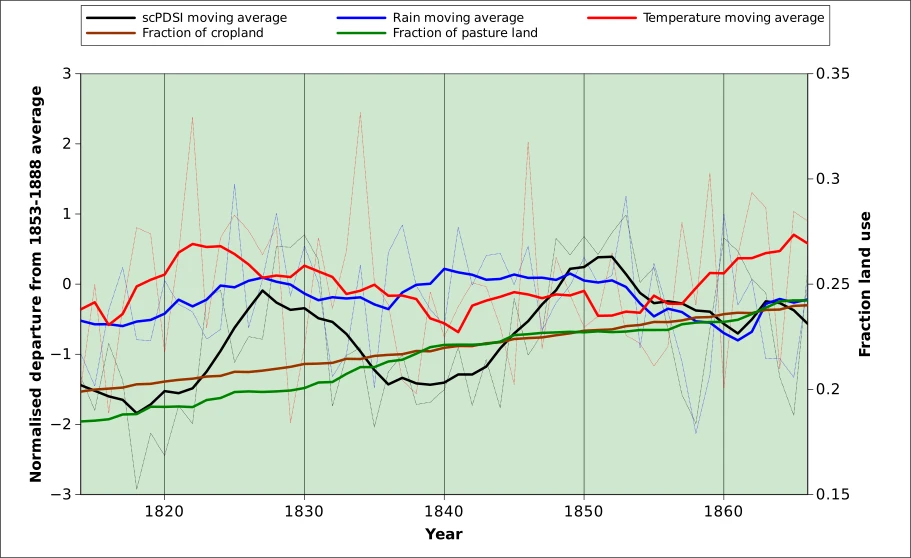
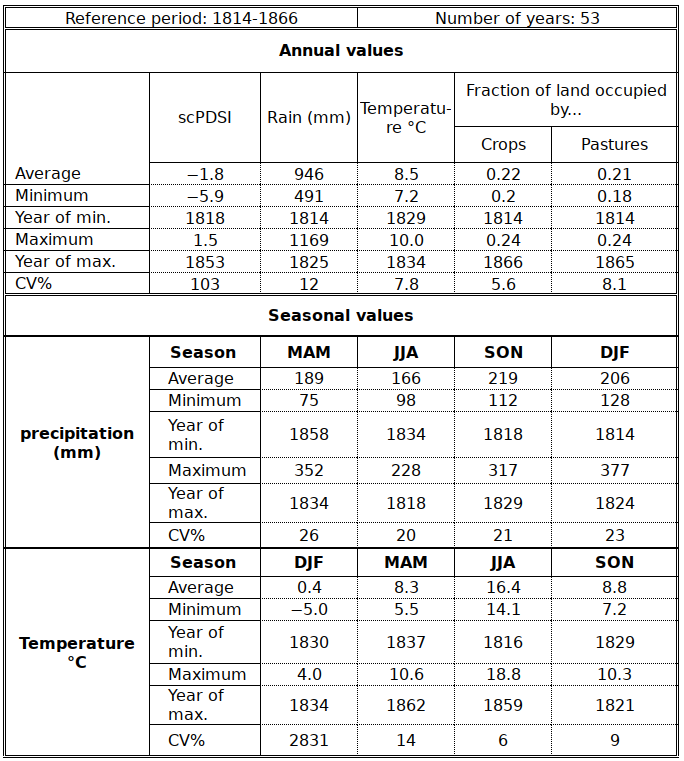
The period of the German confederation was relatively warm during the early 1820s and from 1857, when the warmest spring (1862) and summer (1859) was recorded. Isolated warm years also occurred in between, notably in 1834 – the warmest year of the period due to very mild 1833-44 winter conditions – and 1846.
The coldest winter was that of 1829-30, with a significant drop of 5 degrees below the average of the period. The coldest summer was 1816, a fact well documented throughout the northern hemisphere.
The period experienced a slow but constant decrease of precipitation from the late 1840s to the early 1860s. Both the driest (1814) and the wettest year (1825) occurred at the beginning of the German confederation. and the mid 1860s. The driest years, according to the scPDSI (i.e. in terms of their agricultural impact) , are centered around 1818 and 1840. The wettest years (rainfall in excess of 1000 mm) occurred in 1841,1843, 1844 and 1860.
HIST-4. North German confederation which became, from 1871, the German Empire (Norddeutscher Bund, Deutsches (Kaiser)reich); 1867-1920
The German Empire included essentiallly the territory of the German confederation plus Bavaria, Württemberg, Baden, and Hesse-Darmstadt, which joined at the end of 1870, after the end of the Franco-Prussian war.
The period continued the economic and political consolidation and development that was initiated during the previous period. Fertiliser use – which had been introduced in the late 1860s, became widespread during the period and contributed to continued growth of the agricultural sector.
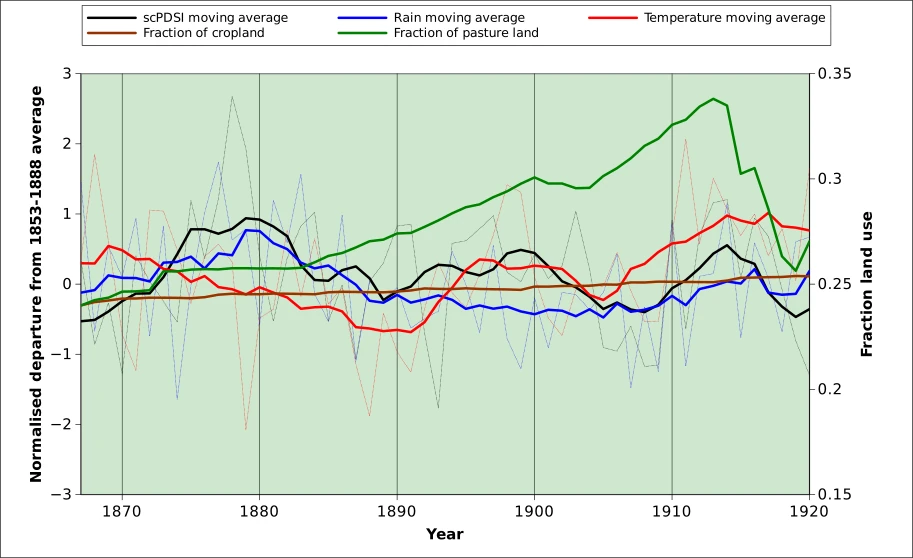
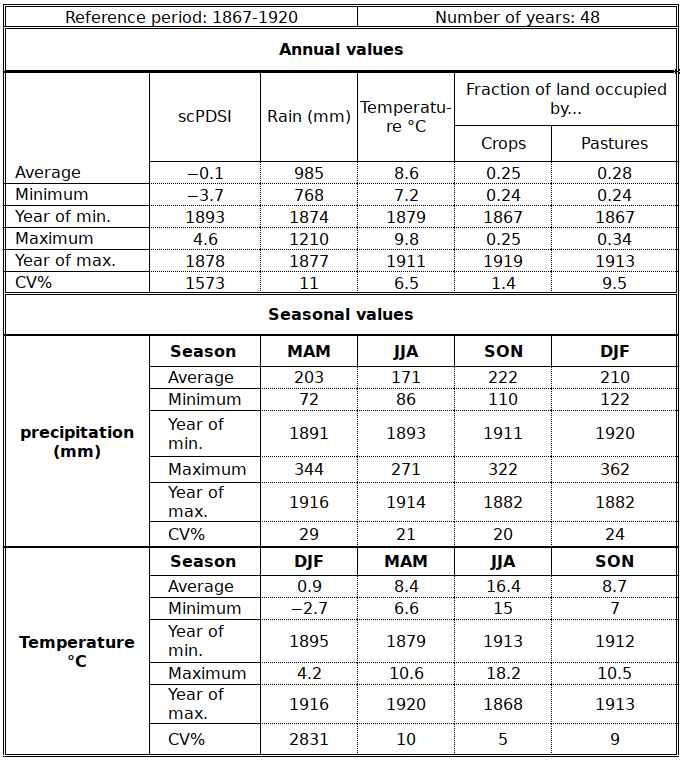
Relatively wet conditions prevailed during the late 1870s and early 1980s. The wettest year of the Empire was indeed 1877, while the driest one had been recorded a couple of years earlier in 1874.
According the scPDSI, the driest year, in terms of impact, was 1893.
Generally speaking, the mid to late 1870s’ years (1877-1879) were favourable in terms of (average) temperature and water supply, resulting in high scPDSI.
Also note that, unlike all other periods and in relation with WWI a drop of pastureland was observed (about 10%).
HIST-5. Weimar Republic (Weimarer Republik)
The Treaty of Versailles (1919) stripped Germany of many territories, and imposed constraints on others. Among the areas lost: Alsace-Lorraine to France, Eupen and Malmedy to Belgium, Northern Province of Schleswig-Holstein to Denmark, parts of West Prussia and Silesia to Poland and the Hlučín Region (German Hultschin, today in Czechia) to Czechoslovakia. Areas with constraints include the following: (1) Saarland was administered by the League of Nations for 15 years; (2) Rhineland – including the localities of the Project – was demilitarized; (3) Gdansk (German: Danzig; now in NW Poland) became a free city and (5) Memel (today: district of Klaipėda in Lithuania).
Altogether, “Germany” lost about 70000 km² (13% percent of its European territories) and just under 7 million people2).
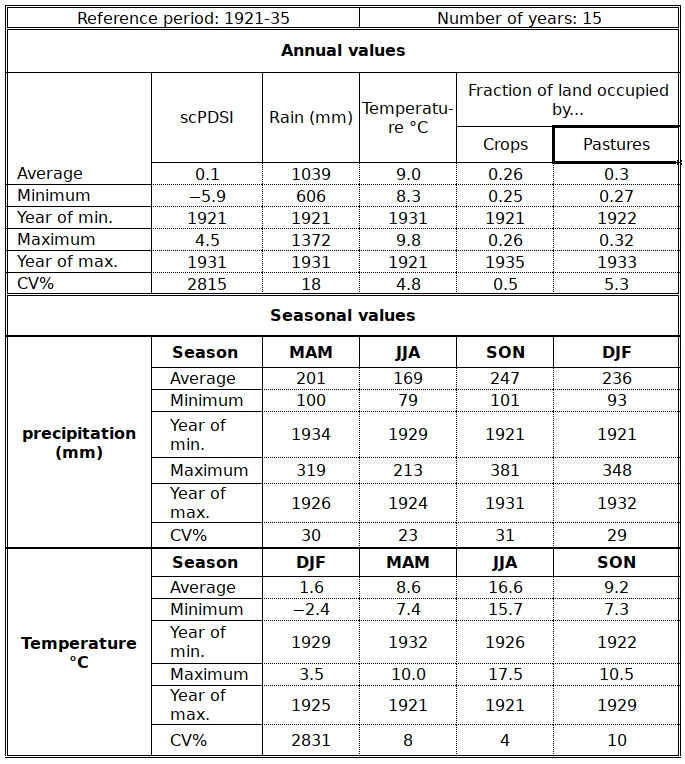
Slightly above- average conditions prevailed during the central years the period (1926-30), although the spring of 1926 recorded only half the expected amount of rainfall.
The most abnormal years of the period were 1921 and 1931. 1921 was the warmest, with the lowest precipitation and near.drought conditions (scPDSI of -5.9); 1931, on the other hand, was the coolest and the one with the largest amount of rainfall. 1921 had low fall and low 1921-22 winter precipitation, while 1921 had the highest spring and summer temperature.
HIST-6. Sources of data
The narrative (and the writer’s perception of the issues) owes a lot to Wikipedia (in particular the pages on the Territorial evolution of Germany) and to Vividmaps. Other sources include IEG-MAPS, Germany history maps and the German studies collaboratory.
- Source: https://commons.wikimedia.org/wiki/File:German1910.png. Here is some of the text (modified!) that accompanies the map: Original uploader and author was Rex Germanus at en.wikipedia. This image is unreferenced. The dark cyan colour apparently denotes areas, where at least 50% of the population would speak “German”. The inset claims it is from the “official national census of 1910”, presumably the 1910 census in the German Empire. But it is not clear what relation this map is supposed to have to the census data, as most of its scope concerns territories which were not part of the German Empire. Presumably the “1910 census” claim is just pulled from thin air to avoid charges of “unreferenced”. Historical maps that could in principle be used as reference: (1881) , (1894), (1906), (1910). There is a comparable map which claims it is derived from on “a map by Dr. V. Schmidt and Dr. J. Metelka”. Presumably, this map is derived from a modern (recent) publication which discussed the 1910 census data. In this case, the map should be attributed to this publication, not to the “1910 census”.[↩]
- Multiple sources, including the Holocaust Encyclopedia and the Daily Mail[↩]