We all develop rules of thumb that help us make operational decisions. One of my personal rules is that “agronomic significance” comes before “statistical significance”. For instance, when assessing regression coefficients, I would discard some of them regardless of their statistical significance if they don’t make agronomic sense. An example would be a negative relation between sunshine and irrigated rice yield. The occurrence is not “impossible”, but it is very unlikely, and certainly deserves a critical examination of data and statistics! Similar situations do occur now and then: This little post focuses on a related issue when decisions have to be taken based on short time series.
About the length of time series required for agronomic analyses, my empirical rule is that we should adopt a period that is between 12 and 15 years. Why? Because the 30 years statisticians (and, in their wake, climatologists) are so fond of (for good “statistial reasons”) are usually far too long for any meaningful agronomic analysis. Everything changes in 30 years:
- Farmers are replaced by their sons, or daughters if you are in some parts of Africa (30 years is a “generation”)
- Agricultural policies go through several cycles (EC orders to plant fruit trees, and then to uproot them)
- The overall economy and national and international market conditions can take unsuspected and unexpected turns (think of the 2008 food price rise!)
- New crop varieties are developed (ever heard of GMO’s?)
- Farmers modify their practices (irrigation techniques, fertiliser type and application method, phytosanitary products)
- Fashions come and go (dry planting Vs wet planting, World Bank thinking on farm subsidies, statistical sampling techniques) etc.
As a result, I prefer to use a period that’s sufficiently short to avoid many of the listed issues, but yet sufficiently long to have some statistical weight. This applies, in particular to yield and production trends. Trends incorporate many factors. Five years is really too short to meaningfully assess a trend, because this is about the time it takes for agricultural policies to be adopted by the farming
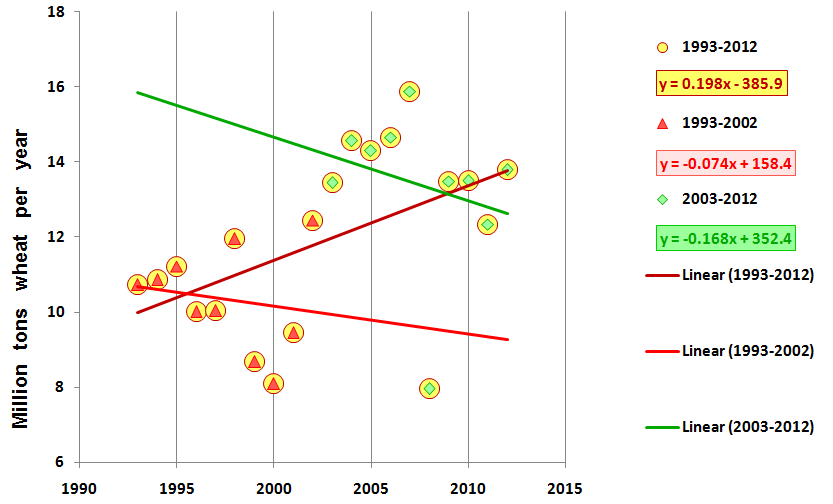
Iranian wheat production trends between 1993-2002 (red triangles, decreasing 74000 tons per year), 2003-2012 (green lozenges, decreasing 168000 tons/year) and 1993-2012 (yellow circles, increasing 198000 tons/year). The statistical significance is usually low: R-squared is 0.027 for 1993-2002 and 0.057 for 2003-2012, but 0.25 for the whole time series from 1993 to 2012. Graph based on data downloaded from FAOSTAT (http://faostat3.fao.org/faostat-gateway/go/to/home/E)
community, and also the time it takes to the farming community to adapt to the prevailing economic conditions whenever the required change take more than just switching varieties. For instance, when infrastructure changes are required (irrigation, transport, storage), the time constant is around five years. And we should not forget inter-annual variability of yields brought about by weather. For farming to be meaningful, the risk of severe crop loss should not exceed “2 or 3 years out of ten”, which is to say, approximately 1 year out of five. In other words, when computing trends over 5 years, particularly in semi-arid areas, there is a risk that the period will include one atypical year that will pull the trend up of push it down, with the result that it is not very meaningful, i.e. that it does not actually describe expected long-term (structural) behaviour of agriculture, but rather conjectural effects.
If 5 years is too short, then 10 years should be acceptable: the period is still short, but “erratic” fluctuations should be ironed out by averaging. Yet, the reality can be different, as shown in the figure, which illustrates wheat production trends in Iran over two successive 10-year periods: the trend is negative for each of the two decennia, but the long-term production trend (over 20 years: 1993-2012) is positive! Obviously, some other statistical method should be applied!
But let’s come back to the issue of “statistical Vs. agronomic significance”: the graphs tell us that we are in a situation where more than “2 or 3 years out of ten” suffer very poor conditions, and certainly raise some questions that go beyond statistics. Is this sufficient to revise the “rule of thumb?” I think not!