This post analyses the trends of yield, area, and production in the 31 countries that together make up 80 percent of the world supply of maize, rice, wheat, and soybean. These 31 countries (actually 30 + 1, where 1 stands for China) which are the key focus of CropWatch analyses, also provide 80 percent of internationally marketable surpluses; they include all continents, in particular Africa. The 31 countries also represent about three quarters of the world population. After an overview of population trends the sections below discuss agricultural trends—with a focus on maize, rice, soybean, and wheat—and a global outlook of food supply (See Note 1 for an important caveat, and Note 2).
Background: National Population Trends
For the 30 countries included in the analysis, population trends have varied significantly since 1990. Figure 1
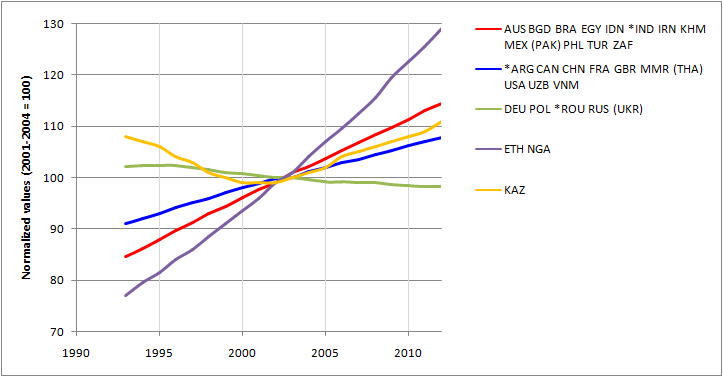
Figure 1: Population trends in major food producers and some of the most populous countries in Africa. The average value for 2001-2004 is set at 100; for a list of country names, see table 1 below. The figure shows the behavior of countries with similar time profiles grouped in “clusters;” an asterisk identifies the most “typical” country within the cluster, while the one that is farthest from the center of the cluster is shown between brackets. Figures 1 to 5 all result from a statistical clustering of the 1993-2012 time profiles using S. Griguolo’s ADDATI software, which can be downloaded from http://circe.iuav.it/~silvio/addawin_site/addawin_en.html.
shows that population growth remains highest in some of the most populous African countries (Ethiopia and Nigeria), while Egypt and South Africa fall into the next highest category together with countries in South and South East Asia, Brazil, Mexico, and Turkey. Declining populations can be seen for Russia and the Ukraine, and among members of the European Union (Germany, Poland, and Romania). Most interesting is the behavior of Kazakhstan, where the population declined until the turn of the century, in the wake of the geopolitical changes associated with the end of the first cold war, to start increasing again thereafter.
Recent Changes in Agricultural Production Trends
By combining population trends with changing agricultural trends, an interesting picture of national-level changes emerges. Table 1 illustrates, by country, changes in crop production trends, comparing the more recent 2003-2012 production trends to the earlier 1993-2002 trends for each crop. Changes in the country’s population trends between the two same periods are shown in the last column. For both sets of trends (agricultural and population), blue (Class 6), green (5), and yellow (4) background colors indicate an absolute or relative “improvement” in trend between the two periods, while the two shades of orange (Classes 3 and 2) and red (1) stand for a deterioration.![]()

Table 1: Changes in crop production and population trends between 1993-2002 and 2003-2012. Background colors indicate the change in trend between the 1993-2002 and 2003-2012 trends, according to the following convention: Blue (Class 6): from positive to more positive (acceleration); Green (Class 5): from negative to positive; Yellow (Class 4): from negative to less negative; Light Orange (Class 3): from positive to less positive; Orange (Class 2): from positive to negative; and Red (Class 1): from negative to more negative. In the case of population trends (column 5), the change in trend is indicated by both the color and the corresponding class number. In the case of agricultural trends (columns 1-4), only the color indicates the class, while the letters indicate the main factor driving the recent 2003-2012 trends, with A standing for Area, Y for Yield, and A=Y indicating changes in both area and yield contributed to the trend in comparable amounts. A white background identifies countries where data are not available to compute one of the trends, usually the 1993-2002 trend, such as in the case of soybean in Bangladesh.
As shown in the table, in terms of population most countries are in Class 3 (light orange), indicating a change from a “positive” to a “less positive” trend and pointing to a relative slowdown of population growth after 2003 compared with the preceding decade. Class 3 countries for population include China and other major Asian countries such as India, Pakistan, Bangladesh, and the Philippines. In other areas (such as Australia, Ethiopia, and France), population growth—sometimes because of immigration—has accelerated. Kazakhstan again is unique in that its negative 1993-2002 trend gives way to a positive 2003-2012 trend, resulting in a Class 5 (from “negative” to “positive”) classification. Because table 1 only compares changes in the absolute values of trends, table colors only indicate the direction of change, not the intensity of it.
In terms of the agricultural trends, other changes in trends take place, with countries showing various combinations of growing and decreasing population and crop production trends. Table 1 indicates major “deteriorations” (Class 1, red)—due to environmental, local, and global economic circumstances or national policies—in Iran (for wheat, mainly due to decreasing yield), and in Mexico (rice), Pakistan (soybean), and Romania (maize), in all three cases due to decreased areas. While production decreases stemming from reductions in cultivated area usually point to policies or a loss of farmers’ interest in favor of some other crop, decreasing yields (as in the case of Iran) are mostly due to reduced water availability for agriculture (Faramarzi et al., 2010; See Note 3) Most changes from positive to negative trends (Class 2) result from changes in area or a combination of area and yield decreases.
Changes in maize production trends
In most countries, the harvested area for maize has remained relatively stable, with only slight increases in area after 2009. A marked increase in maize area (+70 percent compared with the turn of the century) occurred in Iran, Myanmar, Poland, Ukraine, and Vietnam, with even larger increases taking place in Russia and Cambodia (both above 200 percent), but with marked instability.
Maize yields have varied since 1993, compared to the 2001-2004 average. As shown in figure 2, major maize
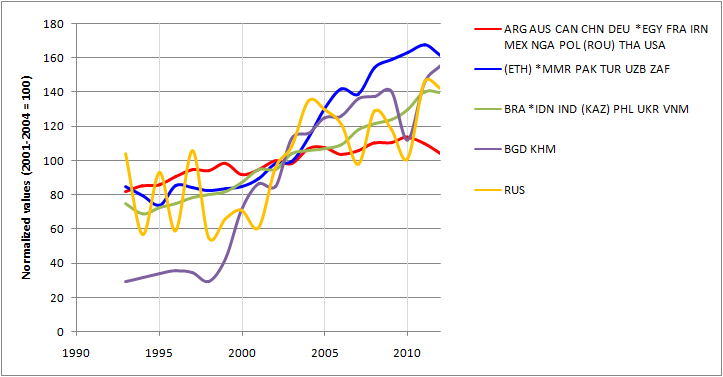
Figure 2: National variations in maize yield since 1993. See note for figure 1. Variables are expressed as an index compared to the average value for the period 2001-2004, which was taken as 100.
producers such as Argentina, France, and the United States have experienced yield variations between index values of 80 to 110 between 1993 and 2005, but yields have since remained relatively stable, around an index value of 115. Rapid increases in maize yield took place in two groups of countries, as indicated by the green and blue trend lines. The first, showing a 40 percent increase over the last decade, represents yield increases in Brazil, Indonesia, India, Kazakhstan, the Philippines, Ukraine, and Vietnam. The second, indicating as much as a 60 percent increase, is the trend for Ethiopia, Myanmar, Pakistan, Turkey, Uzbekistan, South Africa, Bangladesh, and Cambodia, with large yield fluctuations in the two last countries. The data suggest a sustained and successful effort to increase maize production in Myanmar, Ukraine, and South Africa.
Changes in rice production trends
In general, major rice producing countries have undergone and continue to have only slight increases in yields. Typical increases are from an index value of 90 to 110 in countries such as Argentina, China, India, and Indonesia, but much larger increases (from 70 to 150) have taken place in Brazil, Cambodia, Russia, Turkey, and Ukraine. Somewhat erratic variations in both area and yield were observed for Uzbekistan and Romania, indicating difficulties with changing from a centrally planned to a market economy. Rice production in other countries, such as Australia, illustrates the country’s difficulty in coming to grips with rice and making it a stable part of production as both areas and yields fluctuate more than would be expected from environmental impacts only. Ethiopia is singled out as the country where rice areas have increased five-fold from the beginning of the 21st century.
Changes in soybean production trends
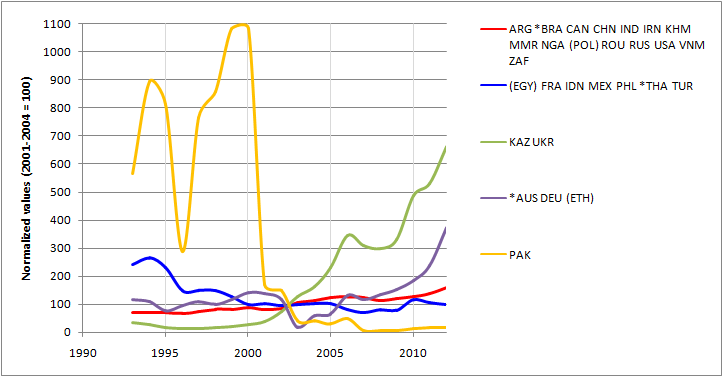
Figure 3: National variations in soybean area since 1993. See note for figure 1. Variables are expressed as an index compared to the average value for the period 2001-2004, which was taken as 100
On the global market, soybean is characterized by its unusual pattern of having only three main producers (the United States, Brazil, and Argentina) and one dominant buyer (China), a situation in which both producers and buyer are vulnerable. This vulnerability could be reduced if additional countries could take advantage of the high demand for the crop, which is not likely to abate in the near future. However, although a number of countries have invested in soybean, some are already gradually pulling out or reducing their share of global soybean areas, such as Egypt, France, Indonesia, Mexico, the Philippines, Thailand, and Turkey (Figure 3).
A significant effort in soybean cultivation is noted for countries such as Australia, Germany, and Ethiopia (which roughly tripled soybean areas since the beginning of the century), and particularly for Kazakhstan and Ukraine (a six-fold increase in area). On the other hand, figure 3 also illustrates that Pakistan is literally phasing out soybean cultivation. According to Pakistani sources, this can be explained by the traditional cultivation of rapeseed as a source of oil (a situation similar to India) and to the spectacular increase in maize yield (figure 2) due to the improved heat tolerance of the crop, making soybean less interesting to Pakistani farmers.
Changes in wheat production trends
Finally, with few exceptions, wheat yields have been mostly stagnating since 2000 in the major European wheat
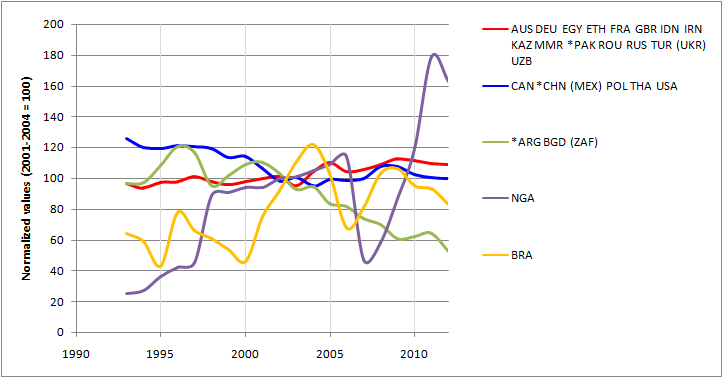
Figure 4: National variations in wheat area since 1993. See note for figure 1. Variables are expressed as an index compared to the average value for the period 2001-2004, which was taken as 100.
producing countries (including Russia) and Mexico. A 20 percent increase in yield was achieved in Argentina, Brazil, China, Pakistan, Thailand, Turkey, and the United States, while yields increased as much as 40 percent in Canada and Myanmar, as well as in three African countries (Ethiopia, Nigeria, and South Africa). The yield increase (mostly of winter wheat) is significant, but usually lower than the increase for maize, a summer crop.
As also illustrated in figure 4, wheat area has been decreasing steadily in countries such as Argentina and South Africa for about twenty years, a bit less long (ten years) in Brazil, and less steadily in Canada, the United States, China, and Mexico.
Global Outlook
The general trends described above point to a general and ongoing global dominance of maize, followed by rice and wheat, with individual countries showing their own specific changes in area, yield, and production, based on local preferences and policies, regional and global demand, and agricultural developments under changing environmental constraints.
While between 1995 and 2000, the productions of the main three cereals were still comparable at around 600 million tons each, maize (with a global production currently close to 900 million tons) has since emerged as the main global crop. Rice (as paddy) and wheat still compete for the second place (with each having a global production of around 700 million tons), although with rice already in second place for the last five or six years. Soybean, as discussed above, is produced mainly by just three countries, with a few other countries joining in and others already stepping down production. If maize is truly the cereal of the 21st century, it is mainly because its yields are still improving. Those increasing yields, however, are not the only reason. As a C4 crop, maize is well suited for warm and warming conditions and has a potential yield higher than the best wheat and rice yields. Moreover, the crop is more versatile in terms of uses (e.g., as a source of oil) and less water demanding than rice.
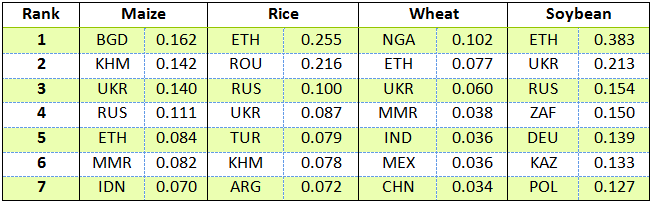
Table 2: Top seven of countries with the highest 2003-2012 crop production growth rates
Growth rates are expressed as the ratio between the slope of the 2003-2012 trend line (expressed in tons/year by country) divided by the average 2003-2012 production (in tons)
Looking forward, national crop production growth rates may also point to future developments in terms of global and national food supply. Table 2 shows the top seven countries with the highest growth rates for 2003-2012 for all four main crops.
Table 2 illustrates some spectacular changes in growth rates in countries that play a minor role in world production, such as Ethiopia, Nigeria, Bangladesh, and Cambodia. Those changes are no doubt modifying these countries’ current national production profiles. Other listed countries include some of the major producers of the crops, and listed changes can potentially alter trade patterns in the not too distant future, for example based on larger outputs in Ukraine (all crops), Russia (maize, rice, soybean), Myanmar (maize, wheat), Turkey (rice) and south Africa (soybean). The growth rate patterns further confirm trends mentioned above, with soybean showing the highest growth rates, followed by maize and rice, and then by wheat—way behind—with a growth rate that is about a third of that of soybean.
Despite its continuing decline in importance (compared to maize and rice), wheat is bound to remain a dominant crop, mostly because of local traditions (as the basis of bread) and because it can be grown as a winter crop. As a summer crop and a crop for locations where mild winters allow the cultivation of both maize and wheat (such as in South Africa), wheat has lost much of its appeal to other summer crops, including potatoes, sunflower and sugar beet. But soybean is the crop where the largest changes are likely, with Africa and Ukraine leading the way.
Acknowledgements: Many thanks to Anna van der Heijden for commeting on/revising the text!
Reference
Faramarzi, M., H. Yanga, R. Schulinc, K.C. Abbaspour. 2010. Modeling wheat yield and crop water productivity in Iran: Implications of agricultural water management for wheat production. Agric. Water Management. 97: 1861-1875.
Notes
Note 1: The focus on Maize, rice, wheat (the main “global cereals”) and soybean results from a “traditional” but biased approach. It is biased because the focus is on commercial production of export crops. Maize, rice, wheat and soybean are the main “commercial” foodstuffs, they are not the main foods people eat in all countries. Clearly, a more food security-oriented analysis would include livestock production, a major sector of the economy not only in major exporters, but also in a very large number of countries with semi-arid conditions in Africa and central Asia. It would also make a lot of sense to include the other so-called “coarse grains” (of which maize is part, but which also include barley and many drought staples such as sorghum and millet), roots and tubers (especially potatoes and cassava), and legumes. There is much more to food and food security than maize, rice, wheat and soybean! Also note that the quantitative contribution of Africa to the trade of the “global cereals” and soybean is, for now, almost negligible. The four Africa nations that are included in the “30 + 1” CropWatch list countries are four of the five most populated countries (with the Congo “DR” missing). The cropWatch website provides detailed background information about the countries; click here.
Note 2: All data that underlie the analyses of the post were downloaded from FAOSTAT.
Note 3: The change in wheat production trend in Iran results from a very peculiar combination of the actual “technology trend” with drought. See another post on this blog for details.