This is the second consecutive annual detailed micro-analysis of a Popillia japonica outbreak in the same limited area. The first post is available in English and in Italian and is referred to repeatedly in the current document.
1. Overview
This is the second post about a local Popillia japonica outbreak during 2025 at Camagna monferrato, Piemonte (Piedmont), North-west Italy. Introductory observations were provided in 2024 and are not repeated here. Generally speaking, the last year’s (i.e. 2024) sampling was weak with too long sampling intervals; there were also errors in the estimate of the number of insects captured due to an obvious underestimation of the weight of late captures1. The shortcomings were corrected in this year’s installment.
2. Environmental conditions
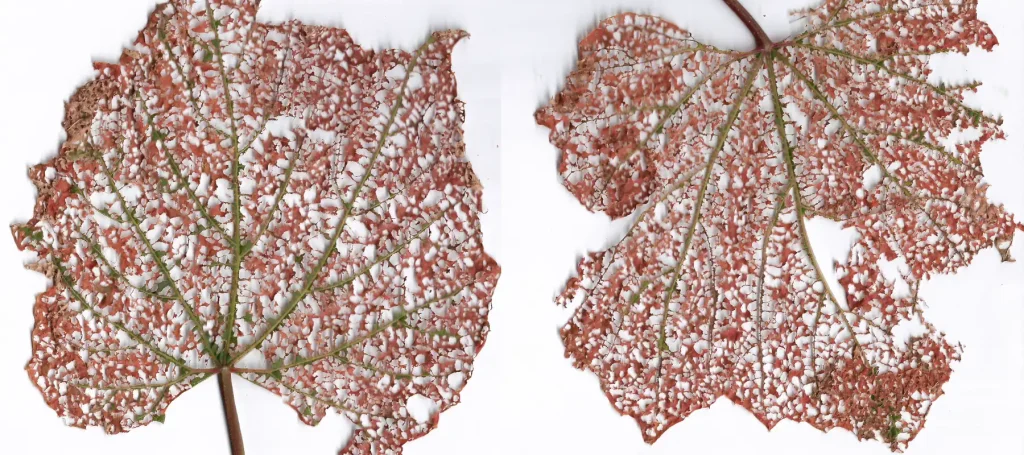
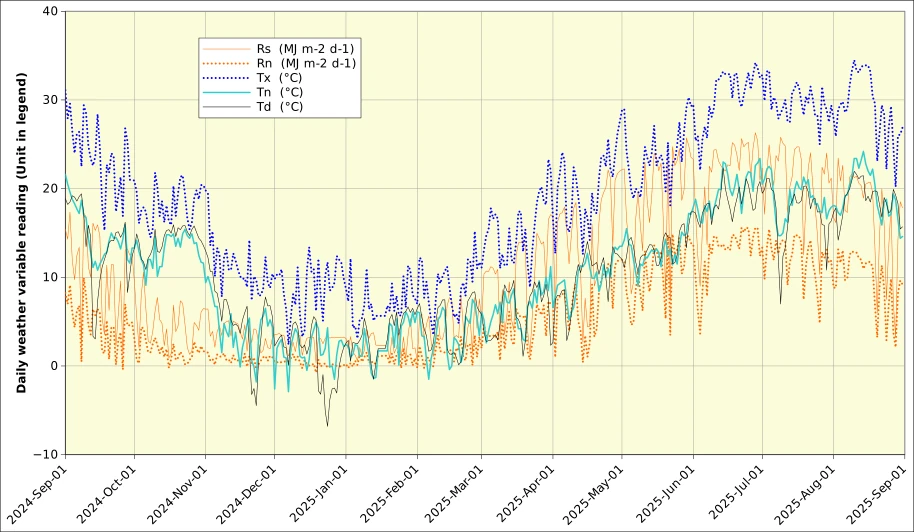
The Popillia outbreak starts in June-July, after which the beetles lay their eggs which develop into the typical melolonthoid larvae of the scarabaeoidea beetles. They spend the fall and winter underground2. We adopt the period from 1 September to 30 August as the Popillia season, i.e. September 2024 to August 2025 for the current season. The weather data are those recorded at my local Bonina weather station. Since this is a recent station that started operating in the summer of 2022, there are no available averages for comparison purpose. The reference is the professional automatic weather station at Vignale3 operated by ARPA, the Piemonte Regional Environmental Protection Agency (Figure 1).
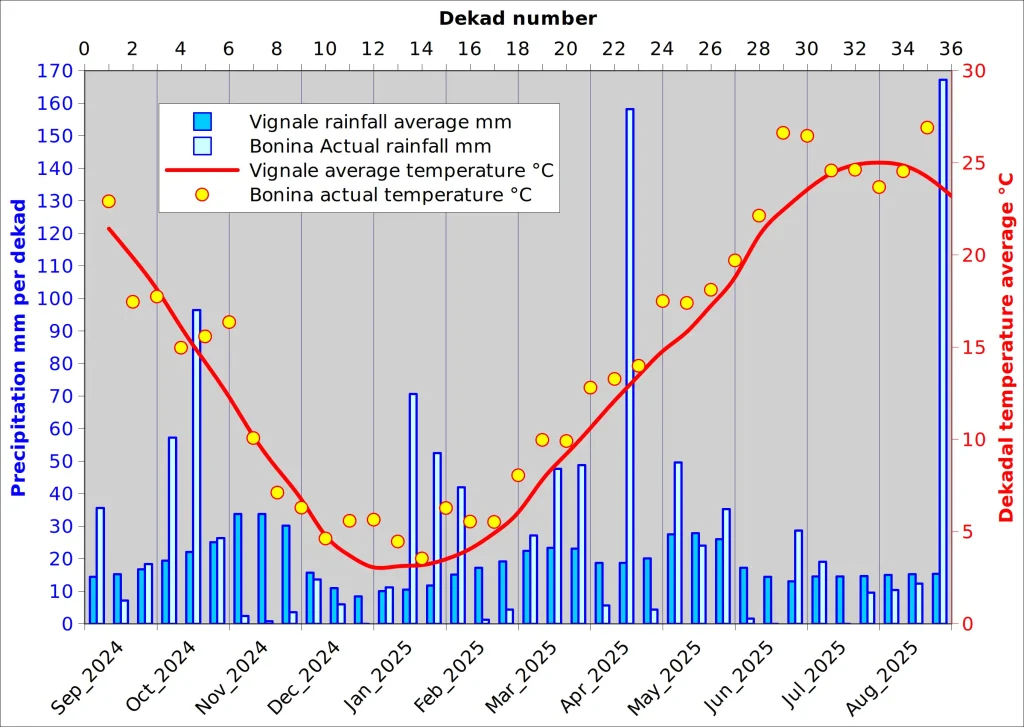
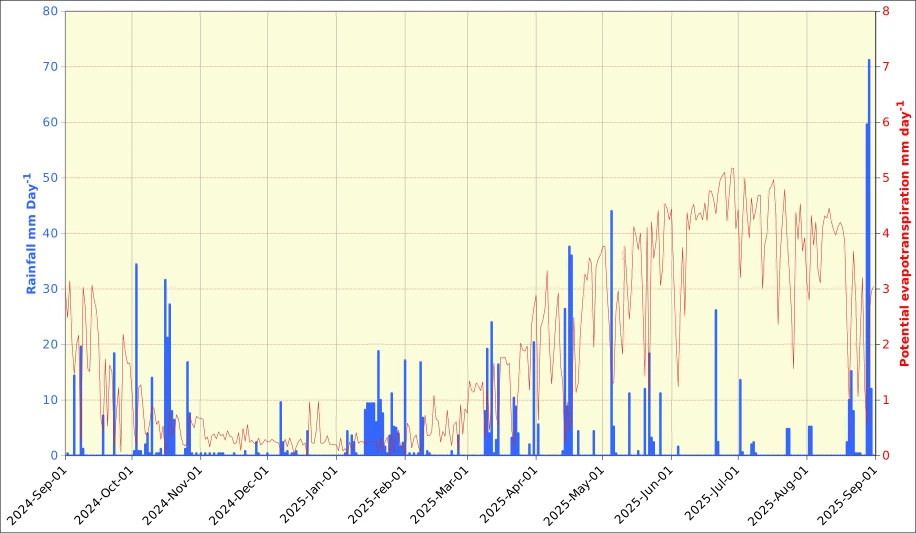
Average Vignale precipitation for the 15-year reference4 period amounts to 671.4 mm. Bonina precipitation tended to be about 10% higher than Vignale for the period for which overlapping data are available (2022-2025), Bonina precipitation amounted to 1098.8 mm due to relatively high rainfall in October 2024, the second dekad of April 2025 and the last of August 2025. Temperatures were about 1 degree higher than during the reference period, amounting to 13.8°C in Vignale and 14.8°C in Bonina. As can be read from Figure 1, temperatures were higher in Bonina essentially during the period from January to June (Bonina: 13.4°C, Vignale average: 11.8°C).
The original daily data are given in graph format as well as downloadable csv files in Annex 2.
2. Number of insects captured
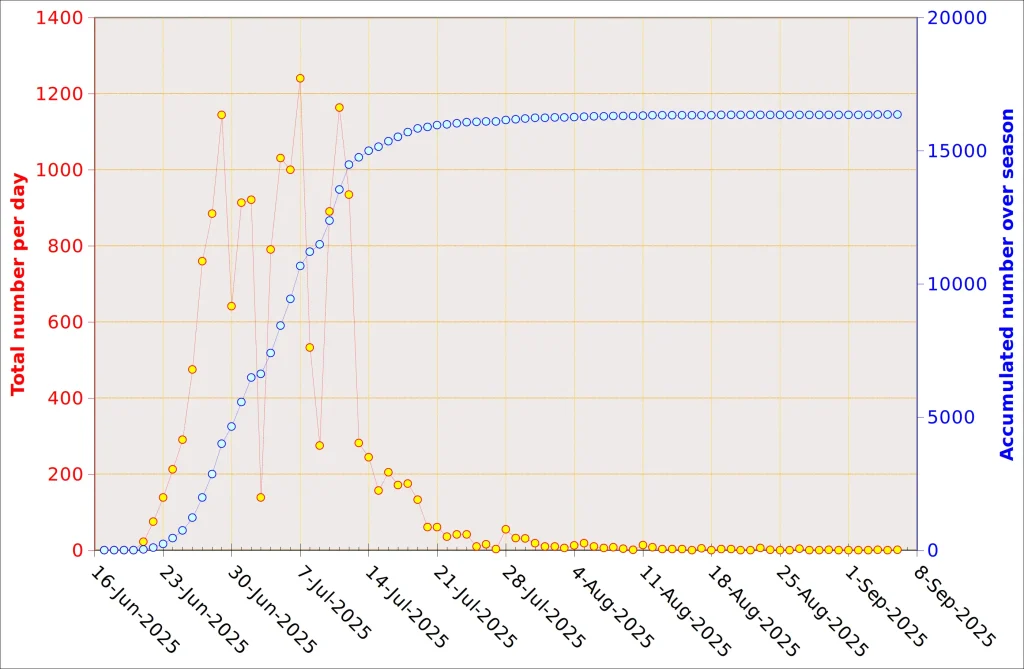
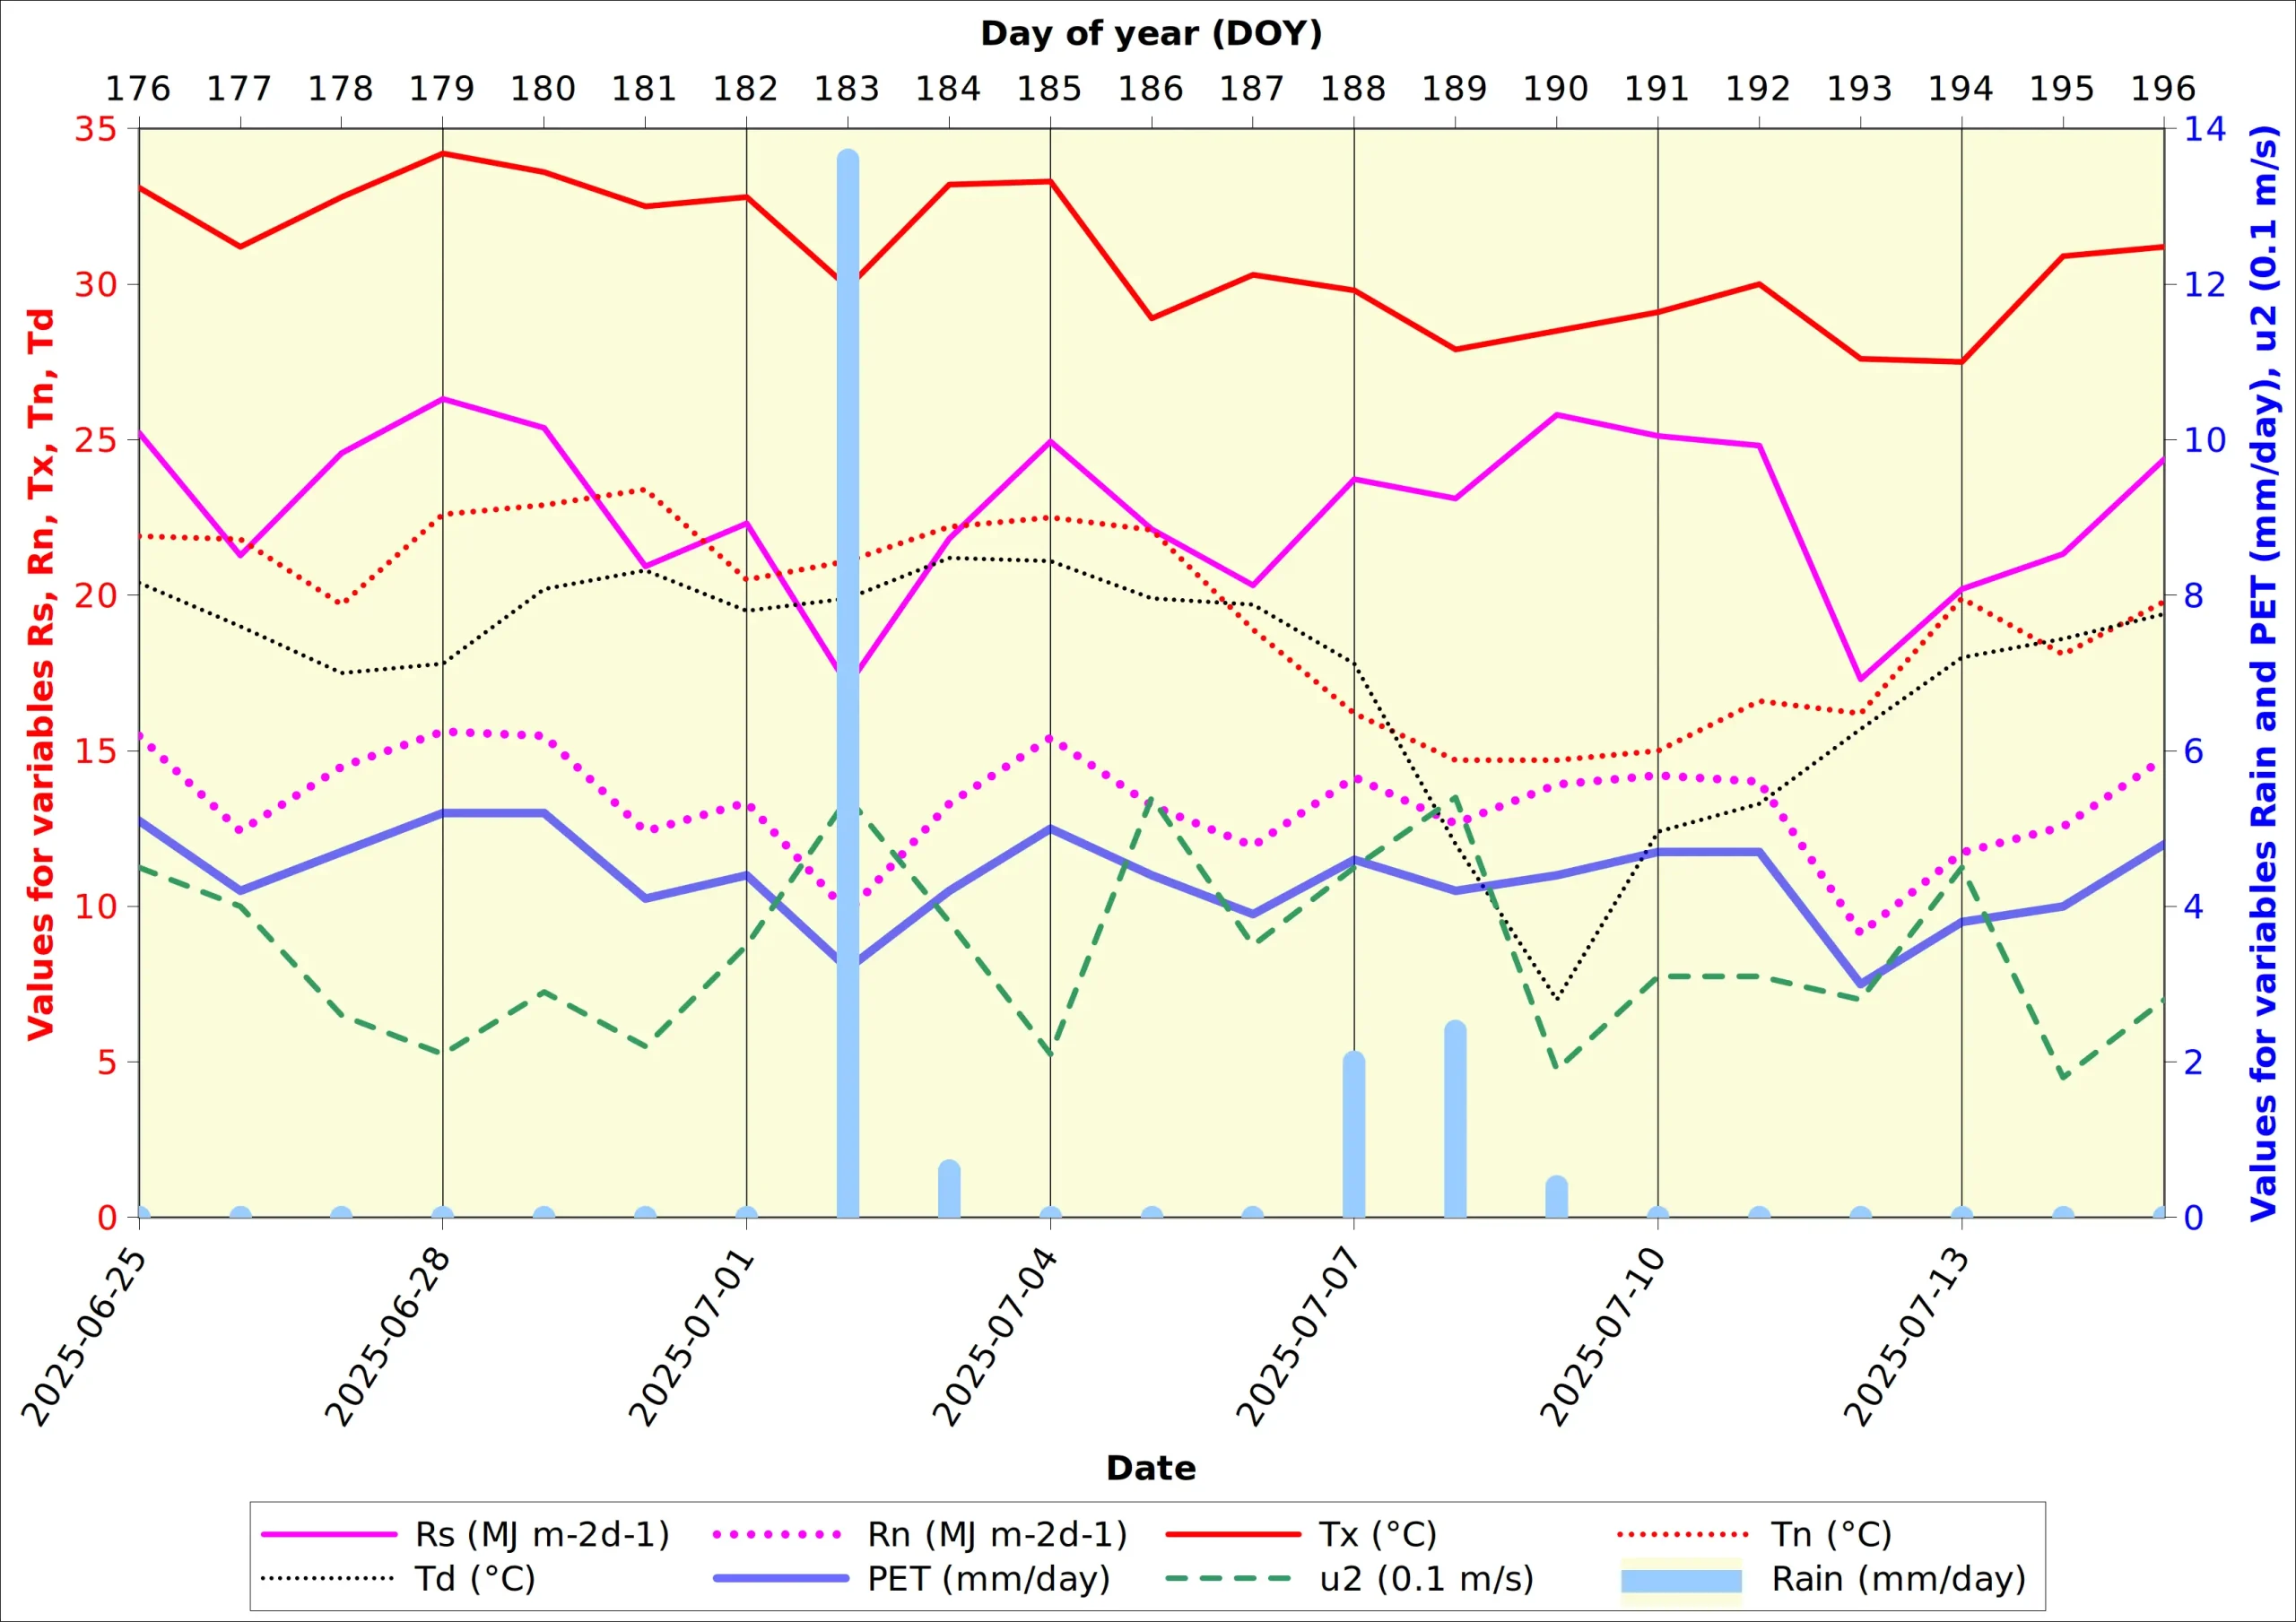
Figure 2 illustrates the timing of insects caught per day as well as the accumulated catch. The first significant numbers of insects were caught between 25 June and mid-July, after which numbers decreased, even if a couple per day continued to be caught up to the first days of September. Significant fluctuations occurred between days, with catches dropping to low values e.g. on 30 June, possibly because trapped insects managed to escape (refer to Annex 1 and Figure Annex 1.2). Very low values on 3 July are clearly associated with relatively high rainfall on 2 July (just under 35 mm; refer to Figure Annex 2.3) followed by lower rainfall on the 3rd. Popillia populations than recovered and turned active for a couple of days, followed by another drop on 8 and 9 July, two rainy days (refer, again, to refer to Figure Annex 2.3), followed on the 9th and 10th by low moisture and probably good visibility as far as the Alps! It is also stressed that looking at the timing of rainfall during the day would probably clarify the issue further.
3. Weight of insects
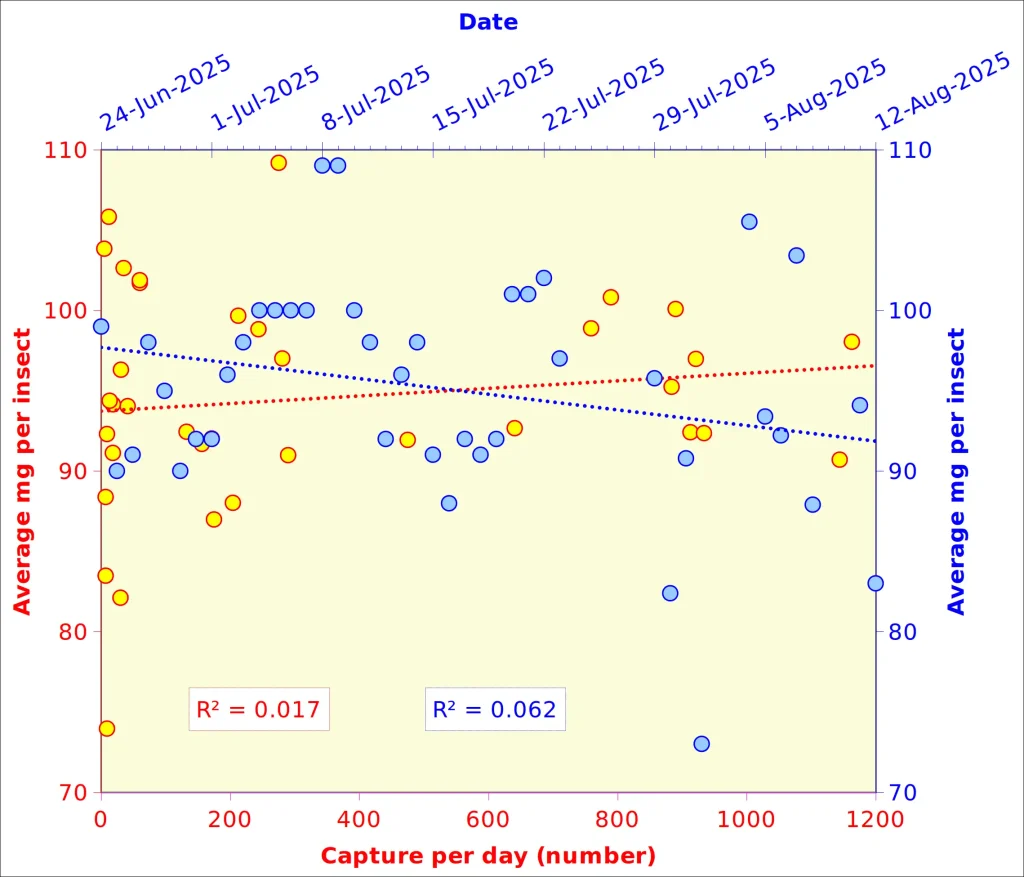
A special effort was made during the 2025 Popillia outbreak to determine the correct weight of the insects. Figure 3 shows the average weight in mg of the insects as a function of two different X-axes: the date (blue) and the number of insects captured (red). The coefficients of determination (0.062 and 0.017), respectively, show that the average weight did not significantly change over time nor as a function of the number of insects captured. The specific interpretation of this point is that the capture effort does apparently not affect the feeding habits of Popillia, illustrating in particular the fact that ample food is available even at peak invasion time5.
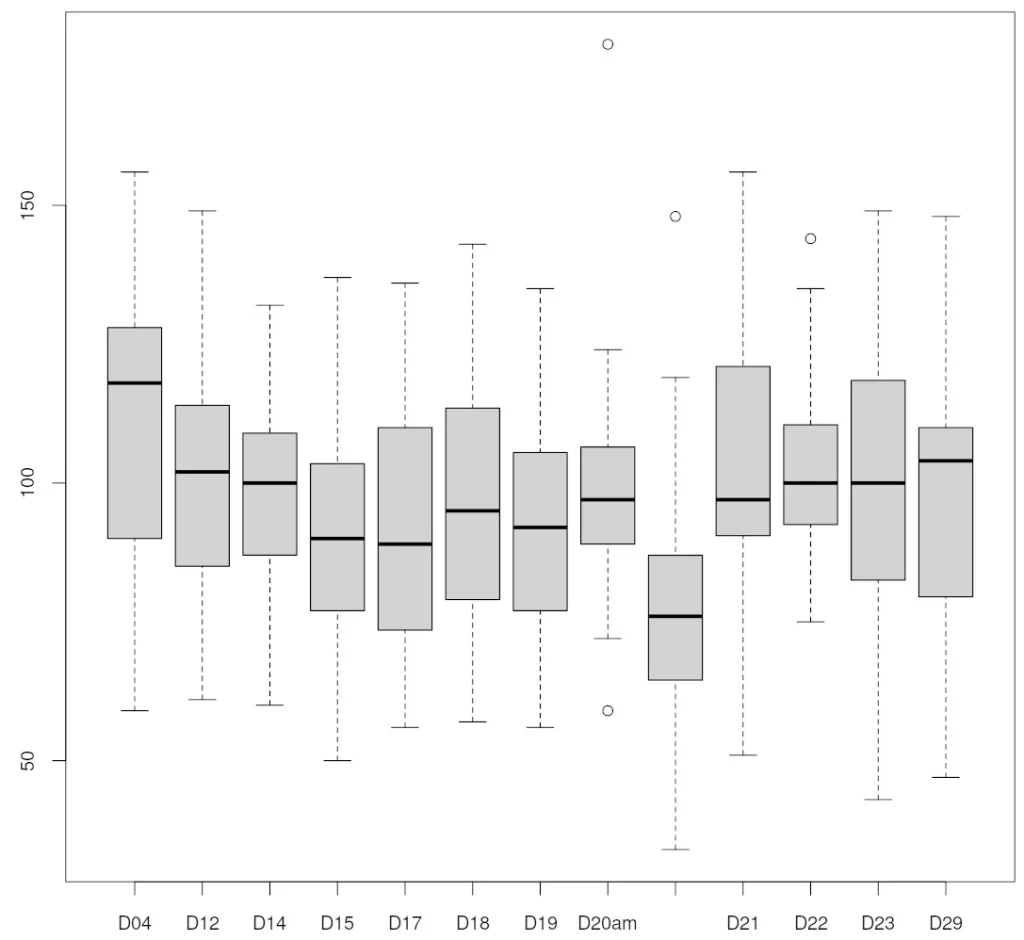
Figure 4 shows additional detail of the weight distribution as a function of the day of capture. The median weight decreased from about 120 mg per insect to about 90 mg in the two first weeks of July (which may point at at least some competition for food!) but then stabilised about 100 mg up to the end of the period. The same batch of insects was weighed twice on the 20th of July, the first time immediately after capture as explained in Annex 1 and then in the evening of the same day about 8 pm, after being left drying for the day. The medium weight decreased from 100 mg per insect to 77 mg (The averages were identical to the median and the standard deviation decreased from 21 mg to 19 mg, n=60). The observation indicates that dead Popillia rapidly lose their water and weighing must take place as soon as soon as possible after the capture.
Refer to Annex 3 for a somewhat more detailed statistical analysis of the distribution of insect weights.
4. Summary
Figure 5 schematically summarizes the 2024-2025 Popillia outbreak at Regione Bonina, Camagna, and compares it with the previous season.
The outbreak started 10 days earlier in 2025 than in 2024, in direct relation with higher than average temperature (Figure 1), and peaked on day 185 in 2025 (5 July) as opposed to day 195 (14 July) in 2024. This is consistent with the SSD6 which reached the 157 degree threshold on 23 June in 2024 (day 175) but on day 165 in 20257. Although two years are hardly significant for the SDD calculations, it is nevertheless interesting that the “Minnesota rules” predict a shift in Popillia phenology that is valid in NW Italy as well!
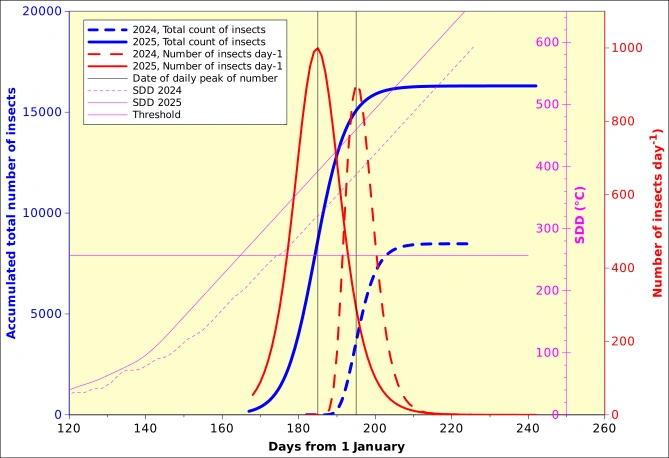
About twice as many Popillias were captured in 2025 compared with 2024 (an estimated 16350 insects). I had naively assumed that, because of the “large number” of insects eliminated in the traps in 2024 (estimated at 8540 insects), the 2025 outbreak would be limited. Instead (refer to Figure 3) , it seems that the Popillia “carrying capacity” if my environment in Camagna is much larger, probably several time larger than I had assumed. Unless some harsher winter conditions set in, it is likely that Popillia catches and damage are bound to increase in the future.
2025 was also characterised by a long tail of individual Popillia captures that lasted for one month (into September, see Figure 2), and which may be the harbinger of a lengthening of the Popillia season.
Overall, Popillia phenology and activity during the outbreak period seems to be directly controlled by weather conditions, including those during the dormancy/larval stages but also during the the period of active flight, where precipitation and overcast conditions immediately limit Popillia movements.
Annex 1: Insect sampling and pre-processing
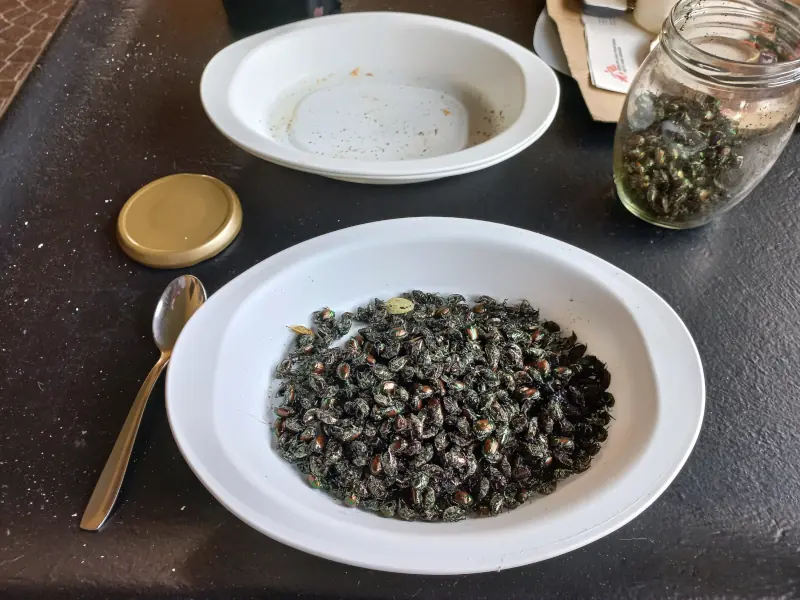
Insects were usually harvested from the three traps in the morning around 7 a.m., put in a glass (marmelade!) container and killed with a couple of cm³ of ether (Figure Annex 1.1). After about 10 minutes, they were subsequently spread out on a small plastic dish to allow for the excess ether to evaporate before weighing, to remove non-Popillia caught inadvertently and other residues (e.g. leaves). The “drying” takes just a couple of minutes due to very high volatility of ether. The pheromone traps are extremely selective, as already mentioned in the previous post relative to the 2023-2024 outbreak.
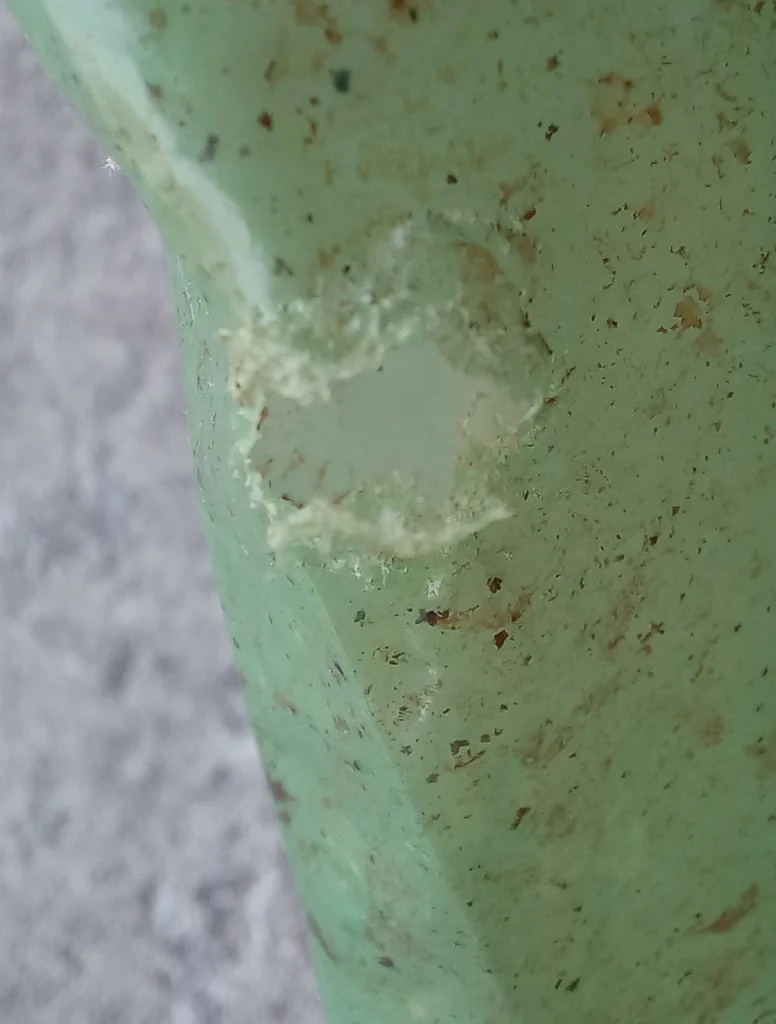
Here is a quick overview of non-Popillia insects inadvertently trapped this season. 30 June: an unknown insects has bitten though the plastic bag at the drainage holes and widened them sufficiently to escape (Figure Annex 1.2). This has obviously also provided the opportunity for an unknown number of Popillias to leave the traps. 2 July: one carpenter bee (Xylocopa). 4 July: one small wild bee (37 mg). 7 July: one rose chafer (Cetonia aurata). 17 July: one small wild bee (74 mg). 18 July: one small green leafthopper (32 mg) and, on 19 July, another 27 mg leafhopper of the same species. 21 July: one small grey shield bug of 60 mg and a 456 mg rose chafer. 6 August: one coreus-like shieldbug. 19 August one leafhopper and an advanced larval stage of the green shieldbug currently infesting basil (which I cultivate as ornamental). 22 August: one small grey wild bee.
Annex 2: additional climatic data
The actual weather data sampled at 10 minute intervals were summarised in the two figures below as daily values. Figure Annex 2.1 has radiation and temperature information while Figure Annex 2.2 contains water budget information: rainfall and PET. Hourly and daily PET were computed using a spreadsheet published by Rick Snyder and S Eching, University of California at Davis8. Their original 2004 spreadsheet was revised in 2015. Net radiation Rn was taken from Snyders’ and Eching’s spreadsheet. The original daily data used to prepare the two figures are available as text csv files in linux format (line terminated by LF) and Windows format (lines terminated as CRLF).
An interesting feature in Figure Annex 2.1. is the similarity of the dew point (Td) and minimum temperature (Tn) curves indicating a rather wet climate with frequent morning fog where minimum temperature is actually controlled by air moisture.
Figure Annex 2.3 provides the same data as Figure Annex 2.1 and Annex 2.2 zooming into the period of maximum Popillia activity from 25 June to 15 July.
Annex 3: statistical distribution of insect weights
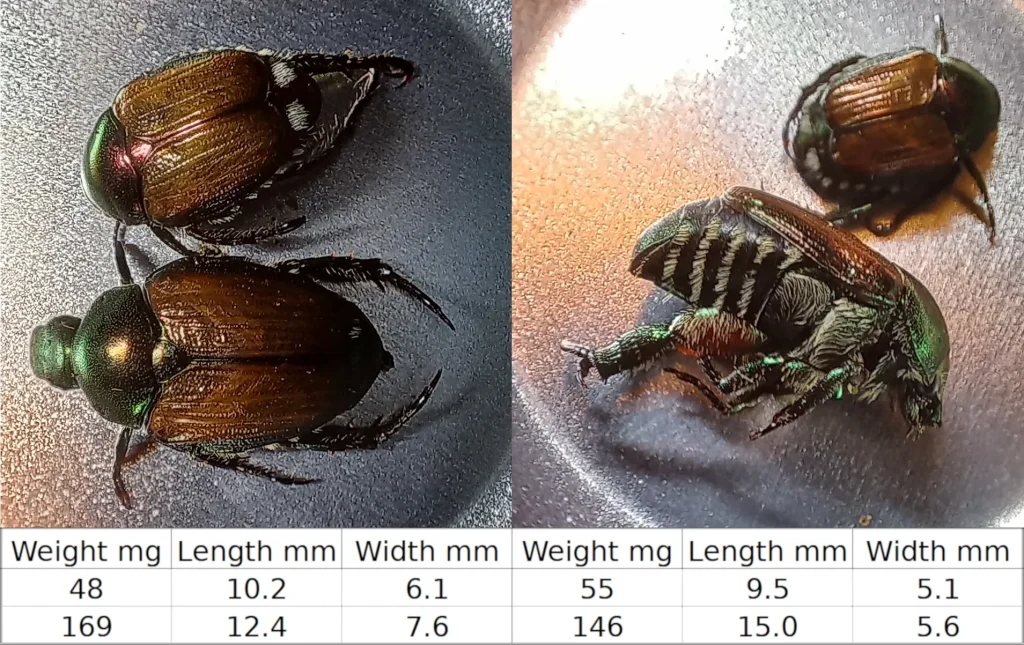
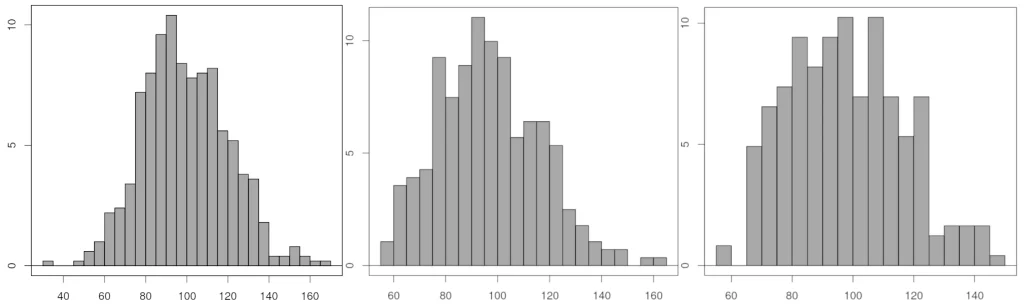
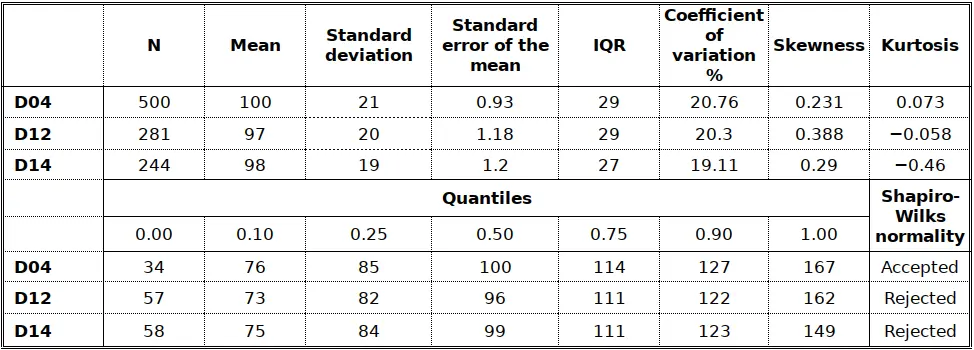
Generally, the captured Popillias display macroscopic size differences, which are, however, not markedly reflected in weights. I assume the differences are due to feeding and mating status, possibly to sex. Figure Annex 3.1 shows some contrasting individuals.
Weight histogrammes are compared for the insects weighted with a precision of 1 mg collected on July the 4th, 12th and 14th (Figure Annex 3.2). Refer to table Annex 3.1. for additional statistics. According to the Shapiro-Wilks test, only the first sample would qualify as “normal” (Gaussian).
Notes
- In 2024 a certain number of insects were counted and then weighed. For instance, 250 insects were counted, weighed with a precision of 1 g on a kitchen scale (this would be about 22 grammes) and then the total number of insects was estimated based an average weight of 88 mg per insect. While this procedure was also used in 2025, in addition about 2000 insects were actually weighted with a precision of 1 mg using a Gram Pres GP50 ” Professional Digital Pocket Scale”. ↩︎
- Details and illustrations are provided in the previous 2024 post (Figure 4). ↩︎
- The station is located at 8.4083° E and 45.01835° N at an elevation of 221 m. My Bonina station is at 8.436780° E and 45.034197° N at an elevation of 181. Slope and aspect of the terrain is comparable and the distance between the stations is 2.8 km. ↩︎
- The reference period was intentionally chosen to be less than the traditional 30-year period of climatologists. ↩︎
- If, on the other hand, Popillia food was scarce, one of the symptoms could have been a decrease of the average weight when large numbers are captured. ↩︎
- SDD, Sum of Degree-Days. ↩︎
- The SDD is computed the sum of temperatures in °C the range from 15.0°C < T < 21.7°C and is supposed to correspond to 10% emergence of Popilia under the conditions of Minnesota when SDD reaches 257 °C. The summation starts on January 1st. Temperatures below 15.0°C are counted as 0°C and those above 21.7 are counted as 6.7°C. Refer to the paper by Ebbenga et al in the previous Popillia post. ↩︎
- The full methodology is described in Penman-Monteith (hourly) Reference Evapotranspiration Equations for Estimating ETos and ETrs with Hourly Weather Data. The spreadsheet itself can be downloaded from https://biomet.ucdavis.edu/doc/PMhr.xls. ↩︎