The post analyses current trends of maize yield and production, and tries to look ahead and see where changes are likely in the future. It is related to a previous post on Global food supply trends in 2014, and beyond! This note was first published in the August 2014 CropWatch bulletin, pages 85 to 88. The current version contains specific bibliographic references that were omitted from the CropWatch bulletin, but otherwise the text is identical. Similar posts were published in earlier issues of CropWatch on wheat and soybean.
Thanks to Anna van der Heijden for editing the text!
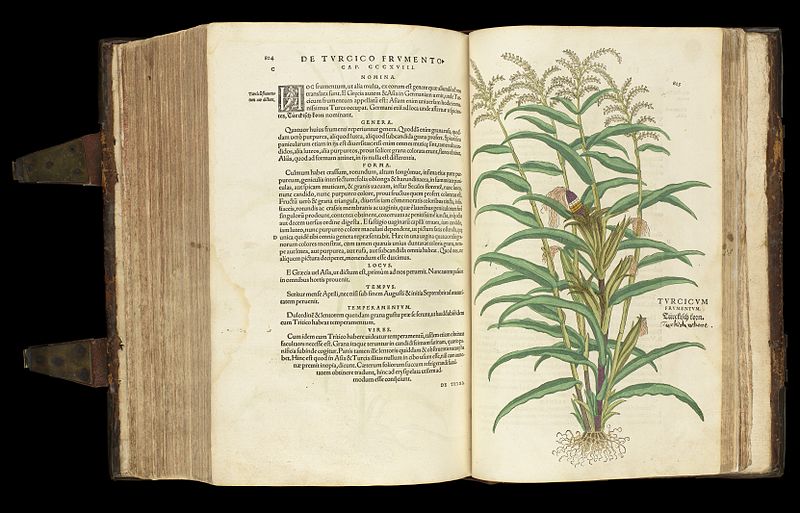
An early representation of maize from De Historia Stirpium Commentarii Insignes {“Notable Commentaries on the History of Plants”). a book by Leonhart Fuchs on herbal plants published in Basel in 1542. Interestingly, the crop is referred to as “Turkish soft wheat.” Source: http://commons.wikimedia.org/wiki/File:Turcicum_plant,_from_%27De_historia…%27_Wellcome_L0051254.jpg
Global areas and uses of maize
About 73 percent of the world’s maize growing areas are located in developing countries, with most areas in low and lower-middle income nations. Maize is predominantly grown under rainfed conditions by smallholders and resource-limited farmers, thus playing an important role in the livelihoods of millions of poor people in Latin America, sub-Saharan Africa, and Asia (Prasanna, 2011).
In all continents except Africa, most of the maize production is used for feed stock, but the use of maize (and maize derived products, including residues) covers the spectrum from food (grain, oil starch, syrup, and feed) to non-food, including energy (ethanol and bio-diesel), green manure, and paper. In the United States for example, 38 percent of maize is processed into animal feeds, followed closely by ethanol and derived products (35 percent), while only 10 percent of maize production is used for food ingredients and just 1 percent directly for human food, mostly as cereal (Barton and Clark, 2014). Maize does, however, play a major role as a food source in places such as Mexico, where it is used for tortillas and tamales, in limited areas in Europe (used as polenta), in some Asian highlands in Nepal, Bhutan, and India, and in many African countries. In the African countries, the preferred maize type is white maize (Prasanna, 2011), with the crop used mostly as boiled flour (ugali or nshima).
Growing yields and production
The many uses for maize have ensured a growing demand for the crop and production has been able to keep up due mostly to growing yields and the crop’s genetic plasticity. Maize production actually “took off” at the end of the 20th century and the crop now dominates rice and wheat in terms of total annual production (Figure 1). The productions of other major crops, such as barley, sorghum, and potatoes have essentially been stagnating since the 1980s, while cassava follows a weak upward trend, mostly because of demand for animal feeds. For the period 2003-2012, the seven countries with the highest crop production growth rates are Bangladesh (0.16), Cambodia (0.14), Ukraine (0.14), Russia (0.11), Ethiopia (0.08), Myanmar (0.08), and Indonesia (0.07).[1]
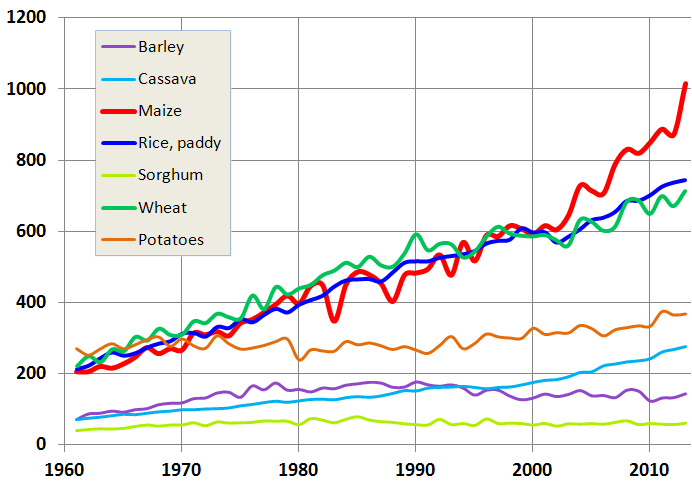
Figure 1. Worldwide production (million tons) of major cereals and tubers since 1961.
Source: Based on FAOSTAT data.
The increase in maize production has been achieved not only through increases in yield, but also a growth in the share of maize area at the expense of other cereals. This indicates that maize has become, in many countries, the preferred cereal. Figure 2 illustrates national variations in maize yield for groups of countries, clustered based on the similarities in their variations over time.
As illustrated in Figure 2, major maize producers, such as Argentina, France, and the United States, have experienced yield variations between index values of 80 to 110 for the 1993-2005 period, but yields have since remained relatively stable around an index value of 115. Meanwhile, rapid increases in maize yield took place in three groups of countries, as indicated by the green, blue, and purple trend lines. The first (in green), shows a 40 percent increase over the last decade, including Brazil, Indonesia, India, Kazakhstan, the Philippines, Ukraine, and Vietnam. The other two (in blue and purple) indicate as much as a 60 percent increase, representing trends for Ethiopia, Myanmar, Pakistan, Turkey, Uzbekistan, and South Africa (blue) and Bangladesh and Cambodia (purple), with large yield fluctuations for the latter two. The data suggest a sustained and successful effort to increase maize production in Myanmar, Ukraine, and South Africa. Although some of the spectacular increases have been those of the minor producers, those dramatic increases may have still markedly affected national production patterns and diets within those countries.
The share of maize among other cereals is illustrated in Table 1 for selected countries. The first six countries—Myanmar to Laos—are characterized by having more than

Figure 2. National variations in maize yield since 1993 for country clusters
Note: Countries are identified by their three-letter ISO codes (http://en.wikipedia.org/wiki/ISO_3166-1_alpha-3). Variables are expressed as an index compared to the average value for the period 2001-2004, which was taken as 100. For each cluster, the most typical country is indicated with an asterisk, while the one that is farthest from the center of the cluster is shown between brackets. The figure was prepared using ADDATI software, available at http://circe.iuav.it/~silvio/addawin_site/addawin_en.html.
doubled their already substantial share of maize in the national cereal production from 1994-2004 to 2004-2013. (The large yield increases for Myanmar and Ukraine were illustrated in Figure 1). The second set of countries—Germany to China—are the world’s top ten producers, from China in first to Germany in tenth place. Russia ranks as the world’s fourth country in terms of production, but is listed in the top of the table for having a factor 3.2 increase in its relative share of maize production among all cereals. With the exception of France, where the share of maize in the total cereal output decreased 10 percent (factor 0.9) and Brazil, where it remained unchanged, most major producers have increased the relative share of maize in their cereal output over the last ten years by 10 to as much as 40 percent (India).
In addition to the countries highlighted in the table, very spectacular increases (more than twentyfold) were observed for a few other countries. While their increases are mostly due to those countries’ very low starting values for share of maize production, increases in Lithuania, neighboring Belarus, and in Bangladesh still mark a dramatic change. In other countries, also coming from very low starting values, relatively more modest but still significant increases are reported for Laos (above factor 4) and Saudi Arabia (factor 9). In the case of Saudi Arabia, this increase is part of the overall increase of food production in the country as a result of irrigation with deep water, which will be phased out completely in 2016. Of the remaining countries with an increase in maize share, less than half (39 percent) have achieved this increase through an increase in maize area at the expense of other cereal production areas.
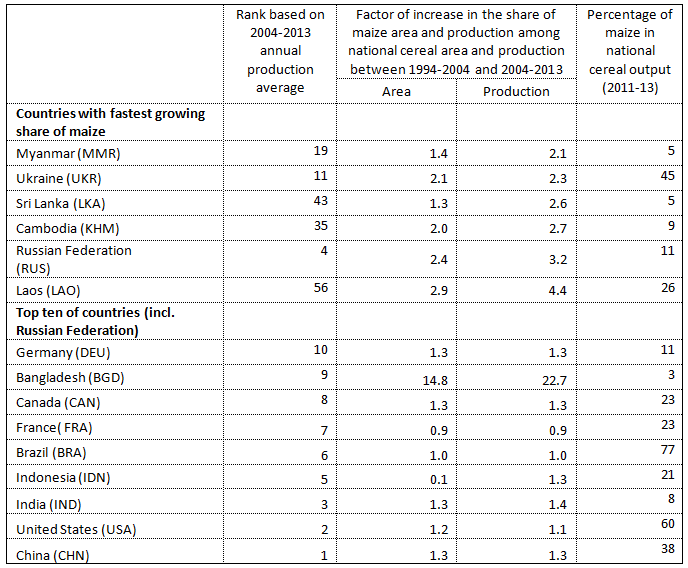
Table 1. Relative maize production and increases in area and production for select countries
Source: Based on FAOSTAT data.
Finally, among the 100 major producers worldwide, six countries have actually undergone a decrease of the share of maize in the total cereal production. This includes Japan and Morocco as well as several central Asian countries (Turkmenistan, Afghanistan, and Uzbekistan). In all countries the drop is close to 30 percent, except in Uzbekistan where it reaches 75 percent.
Looking forward
Looking forward, expectations are that maize will continue to be a leading crop. However, it is unlikely that the fast pace of maize production increase can be sustained more than 10 or 15 years, even if pockets of fast increases persist.
First, land is limited and productions are getting close to their potential based on available sunlight. Many recent publications have discussed the problem of yield gaps—the difference between current yields and those that could be achieved by optimally using resources (van Wart et al., 1013). The rate of yield change is already low in some major producing countries such as China and India (Lobell et al, 2009; Ray et al., 2013) and in some countries with advanced agriculture (Finger, 2010). Techniques are being examined that may have the potential to maintain the growth for some more time in places not ideally suited for the crops (Gover, 2014) or by improving the management of resources (Mueller et al., 2012), but increasing maize yields in some countries will come only at an unacceptably high economic and environmental cost.
Second, in the longer run, climate change impacts may result in a relative advantage of other (non-C4) cereals over maize (Rivero-Vega, 2008; Gommes et al, 2010), particularly in tropical countries where maize is expected to suffer more (or benefit less) than some other crops from CO2 fertilization and improved water use efficiency (Berg et al, 2011, Cairns et al., 2012). New varieties will be needed that are resistant to drought, heat, water-logging and sub-optimal soil nitrogen, with varieties tuned to specific locations to solve anticipated problems (Interagency Report, 2011; Gover 2014).
Finally, it is important to note that maize yields are also more variable than those of other crops (Martin et al. 2005; Poudel and Chen 2012), which has an impact on food security. This variability is due, among other factors, to the crop’s high water use, as well as management and genetic factors (Duvick, 1989). Contrary to lower yielding crops, maize production systems often amplify environmental variability, especially the variability of water supply.
Maize will continue to dominate the cereals production scene, although the links between the agriculture and energy sectors through both the supply side (energy is an important input in crop production) and demand side (maize as source of biofuels) have the potential to stress markets. For the immediate future, FAO and OECD foresee no dramatic price fluctuations (OECD-FAO, 2013). In the longer term, competition for land with other established crops, variable but stagnating yields in many countries, as well as competition from plants with higher water use efficiency, are all likely to work against maize and modify the balance between cereals.
Notes
[1] Growth rates are expressed as the ratio between the slope of the 2003-2012 trend line (expressed in tons/year by country) divided by the average 2003-2012 production (in tons) (FAOSTAT data).
References
Barton B, S E Clark. 2014. Water & Climate Risks Facing U.S. Corn Production: How Companies & Investors Can Cultivate Sustainability. A Ceres Report. Boston, USA. 71 pp.
Berg A, N de Noblet-Ducoudré , B Sultan , M Lengaigne , M Guimberteau. 2011. Projections of climate change impacts on potential C4 crop productivity over tropical regions. Agric. Forest Meteorol. 170:89–102.
Cairns J E, K Sonder, P H Zaidi, N Verhulst, G Mahuku, R Babu, S K Nair, B Das, B Govaerts, M T Vinayan, Z Rashid, J J Noor, P Devi, F San Vicente, B M Prasanna. 2012. Chapter one – Maize Production in a Changing Climate: Impacts, Adaptation, and Mitigation Strategies. Adv. Agron. 114: Pages 1–58
Duvick D N. 1989. 12 Possible Genetic Causes of Increased Variability in U.S. Maize Yields. Pp 147-156 in: J R Anderson, P B R Hazell, Variability in grain yields: implications for agricultural research and policy in developing countries. IFPRI, John Hopkins University Press.
Finger R. 2010. Evidence of slowing yield growth – The example of Swiss cereal yields. Food Policy 35:175–182
Gommes R, H Das, L Mariani, A Challinor, B Tychon, R Balaghi and M A A Dawod. 2010. Agrometeorological Forecasting. Chapter 6 of WMO Guide to Agrometeorological Practices (GAMP), WMO N. 134, Geneva. 49 pp. http://www.wamis.org/agm/gamp/GAMP_Chap06.pdf
Gover D. 2014. Of yield gaps and yield ceilings: Making plants grow in particular places. Geoforum 53:184–194.
Interagency Report. 2011. Price Volatility in Food and Agricultural Markets: Policy Responses. Policy Report including contributions by FAO, IFAD, IMF, OECD, UNCTAD, WFP, the World Bank, the WTO, IFPRI and the UN HLTF. http://www.wto.org/english/news_e/news11_e/igo_10jun11_report_e.pdf
Lobell D B, K G Cassman, C B Field. 2009. Crop yield gaps: their importance, magnitudes, and causes. Annu. Rev. Environ. Resour. 34: 179–204.
Martin K L, P J Hodgen, K W Freeman, Ricardo Melchiori, D B Arnall, R K Teal, R W Mullen, K Desta, S B Phillips, J B Solie, M L Stone, Octavio Caviglia, F Solari, A Brianchini, D D Francis, J S Schepers, J L Hatfield, W R Raun. 2005. Plant-to-Plant Variability in Corn Production. Agron. J. 97:1603–1611.
Mueller N D , J S Gerber, M Johnston , D K Ray , N Ramankutty, J A Foley. 2012. Closing yield gaps through nutrient and water management. Nature, 254: 254-257.
OECD – FAO 2013. AGRICULTURAL OUTLOOK 2013-2022, HIGHLIGHTS. www.oecd.org/site/oecd-faoagriculturaloutlook/highlights-2013-EN.pdfv
Poudel M P, S-E Chen. 2012. Trends and Variability of Rice, Maize, and Wheat Yields in South Asian Countries: A Challenge for food security. Asian J. Agric. Rural Dev. 2(4): 584 – 597.
Prasanna BM. 2011. Maize in Asia – trends, challenges and opportunities. PP 3-6 in PH Zaidi, R Babu, J Cairns, D Jeffers, LQ Kha, GK Krishna, V Krishna, A McDonald, G Ortiz-Ferrara, N Palacios, K Pixley, BM Prasanna, Z Rashid, T Tefera, TP Tiwari, MT Vinayan, V Vengadessan, F Xingming, Y Xu, C Weidong, S Zhang, B S Vivek. 2011. Addressing Climate Change Effects and Meeting Maize Demand for Asia. Book of Extended Summaries of the 11 th Asian Maze Conference, Nanning, China, 7-11 November 2011. CIMMYT, Mexico, D.F.
Ray D K, N D Mueller, P C West, J A Foley. 2013. Yield Trends Are Insufficient to Double Global Crop Production by 2050. PlosOne, 8(6):1-8.
Rivero-Vega R. 2008. Workbook on climate change impact assessment in agriculture; basic knowledge, methodologies and tools. Caribbean community climate change centre, Cuban institute of meteorology and Commonwealth secretariat. ISBN 978-976-95260-1-3. 144 pp. http://www.agrometeorology.org/files-folder/repository/INSAMRogerWorkbookadaptclimchange.pdf
van Wart J, K C Kersebaum , Shaobing Peng, M Milner , K Cassman. 2013. Estimating crop yield potential at regional to national scales. Field Crops Res. 143:34–43.