Per la versione italiana di questo post, clicca qui. For the 2025 follow-up post, click here.
Introduction
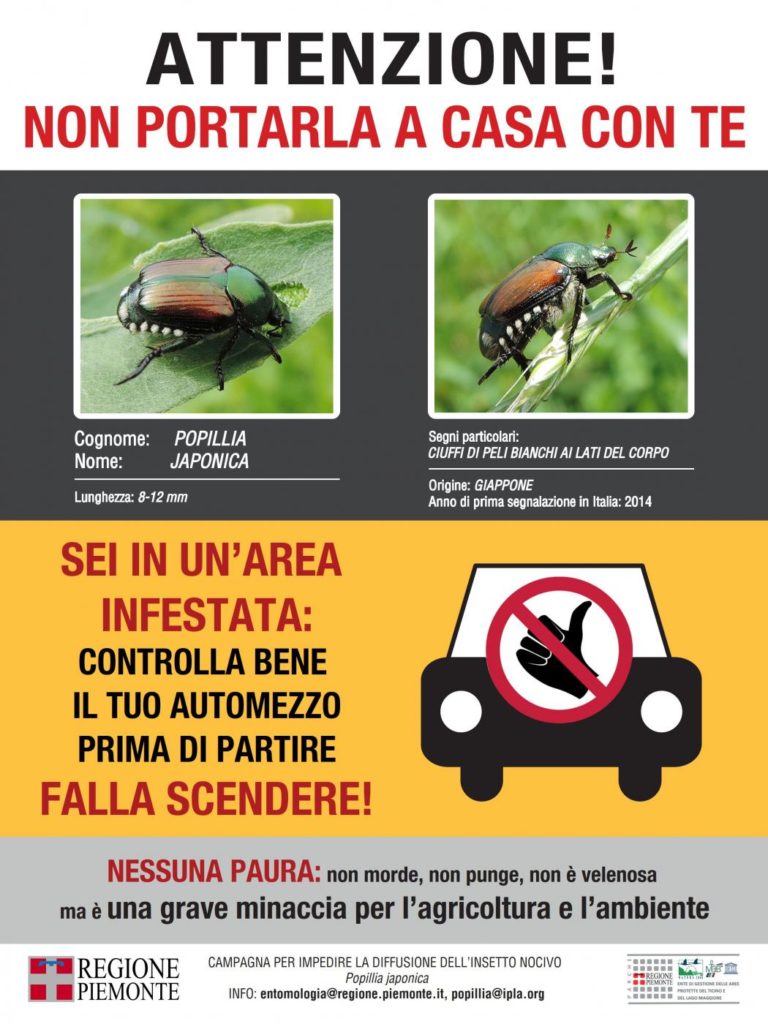
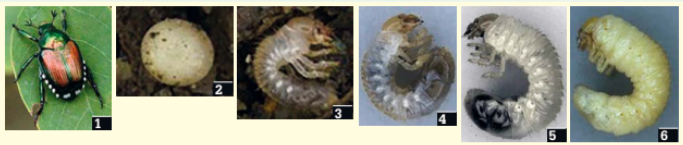
Popillia japonica, the “Japanese Beetle” (whom I’ll also refer to as PJ) appeared in my garden in Camagna Monferrato in 2023. I had seen the numerous warning signs (Figure 2) displayed by the Piedmont region (italian: Regione Piemonte) but I knew little more than that PJ is polyphagous and most of the time, hungry.
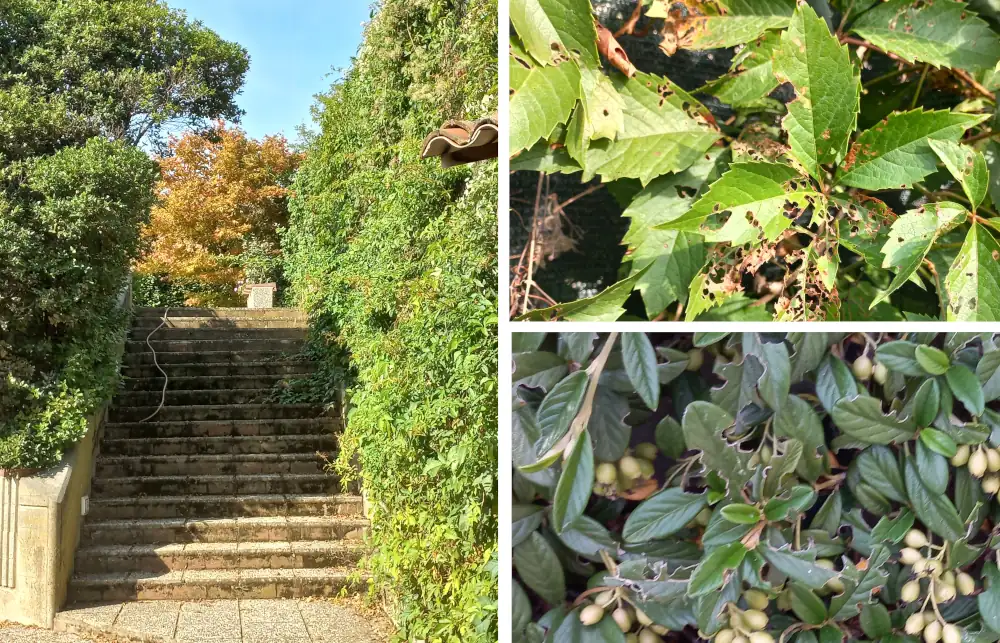
Kindly refer to the photograph in Figure 1 above. In 2023, PJ ate the leaf blades of the ivy on the right of the stair, leaving only the veins, and reduced them to dry brownish “skeletons.” On the left of the stair, the laurustine was badly damaged as well as the willow-leaved Cotoneaster. No leaf was undamaged and I feared that the plants would not recover. Also: I discovered after the invasion has subsided that there were specific traps; I bought two, in anticipation of 2024.
Not knowing exactly when to expect the emergence of the beetles in 2024, I put out one trap of the type displayed here1 at the end of May. The traps remained empty but for a couple of unfortunate Oxythyrea funesta (White spotted rose beetle)2. When the PJ outbeark started at the very beginning of July, I got scared by the speed at which the traps were filling; I put out my second trap and bought one more. The traps were very effective and the damage was considerably less than in 2023. Young leaves even started regrowing while the outbreak was still ongoing (see bottom-right picture of willow-leaved Cotoneaster at the top of this post).
There are some puzzling observations of this outbreak which make me believe that “my” PJs do not come from far away. They are “local”, i.e. “my” 2024 Popillias are the very descendants of the ones that created havock in my garden in 2023 . And since I caught many in 2024, I am very curious to see if the 2025 outbreak will be reduced compared to the two previous ones3! Although my experience with Popillia is very limited, my own observations and discussions with my neighbours give me the impression that Popillia is somehow similar to hail in that the impact does not severely affect large areas at the same time.
Damage by plant species
Although all Popillia warnings insist on the large spectrum of plants attacked, it has been my experience that, on the contrary, Popillia was very choosy in the selection of its food. I did not notice any difference under uncontrolled (2023) and controlled (2024) conditions.
My garden has a large variety of spontaneous herbaceous plants, ornamentals, shrubs and trees4. As already mentioned in the legend of Figure 1, “my” Popillia have a marked preference for Ivy (Parthenocissus quinquefolia), followed by Laurustine (Viburnum tinus) and two Cotoneaster of the species cf. lacteus and cf. salicifolius. The common factor seems to be the vicinity of the staircase5. But other plants in the very same area appear to be completely immune6. They include Pelargonium sp., Hamamelis sp., basil – which I grow as ornamental -, marjoram and Salvia spp. (culinary sage – grown as ornamental – and S. microphylla, Perovskia, Buddleia alternifolia and B. davidii, Nepeta, Rosmarinus, Lavandula, Teucrium fruticans and others.
All those plants around the staircase grow within an approximate radius of 20 m. At some distance (say 30 m and beyond), to mention only woody plants, there are numerous Acer, Berberis, Cornus, Corylus, Eleagnus, Euonymus, Fagus, Hibiscus, Lagerstroemia, Laurocerasus, Prunus, Pyracantha, Quercus, Robinia pseudo-acacia, Rubus, Sambucus, Ulmus … not to forget my Nemesis and Public enemy N.1, Ailantus altissima. etc. No damage whatsoever occured on those plants in 2023 nor in 2024.
When I moved one of the traps to an Elm (Ulmus sp.) about 15 m N of the staircase, I had some damage in the elm; this is, however, not worrying as the plant tends to be invasive.
Poggi et al. (2022) have a “phylogenic” diagramme showing “more” and “somewhat less” preferred plants by Popillia in France7. Although my experience and sample is admittedly limited, none of the “more prefered” food plants from the list suffers any damage from Popillia, including several species of Prunus (one of the most common plants in the local “woods”8).
Some chorological and phenological data on Popillia in Italy
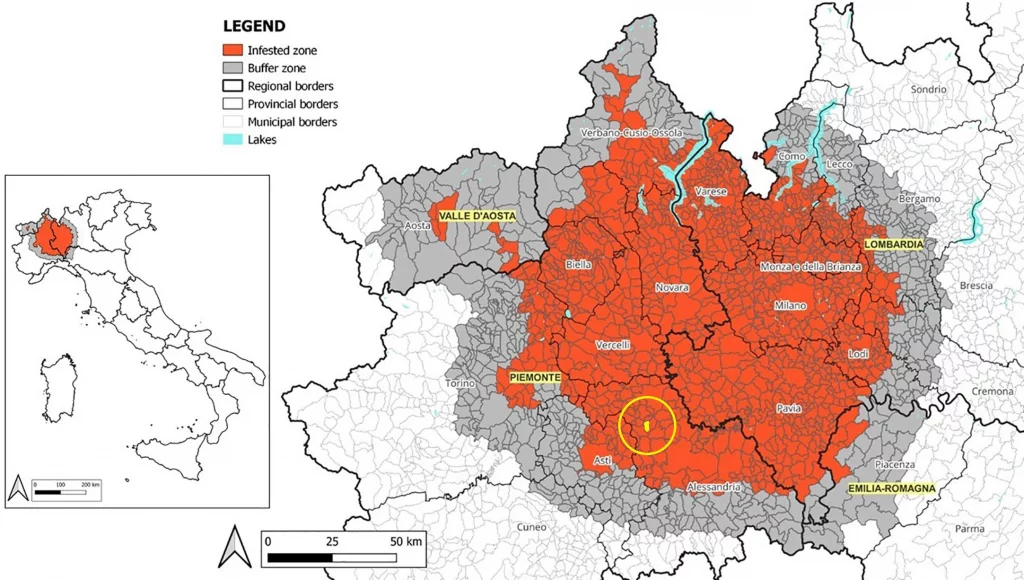
There is ample literature on PJ in Italy. The map below (from Gotta et al., 2023) indicates the location of the main area of extension of PJ in Italy during 2022. The almost perfectly circular patch is about 140 km across. The authors inform us that the beetle was first spotted in Europe in the Azores in 1970. In Italy, it appeared in 2014, more precisely in the Ticino Natural Park established on the Ticino (Tessin) river, the emissary of lake Maggiore and a left bank affluent of the Po river. The Ticino Natural Park is a 66 km² protected landscape area in IUCN category V, at the very centre of the distribution area. It is somewhat ironic that PJ should have chosen a protected area, but maybe not so surprising considering the heavy pesticide doses applied in the Po valley!9
Gotta et al. inform us that from 2021 new occurrences of PJ were reported in other parts of Italy, including Sardinia island and the north-easter autonomous Friuli Venezia Giulia regions. PJ disperses at about 5 to 13 km/year and the insect flies mostly in the warm early-afternoon hours when the air is relatively dry (Paoli et al., 2023).
Gilioli et al. (2022) provide interesting information about the phenology of PJ in the eastern half of the infestation area, in Lombardy. Based on 2015 to 2019 data, the authors modelled the influence of soil temperature on the larval diapause termination and on the development rate function of post-overwintering larvae and pupae… The table below was prepared by this author based on the supplementary data available in Gilioli et al.
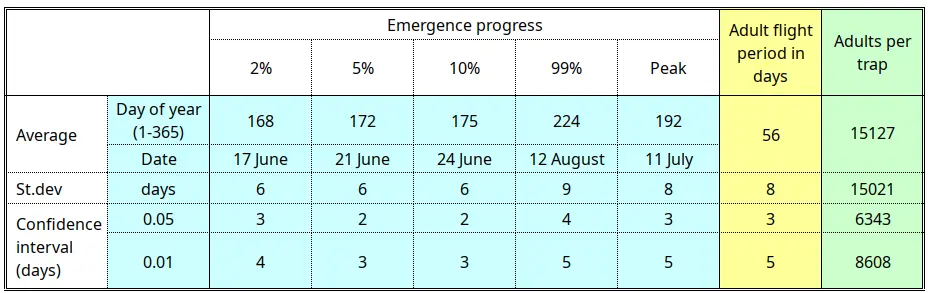
Overall, PJ is active during a very limited period of time (56 days on average, 51 to 61 days with a 99% probability). As will be mentioned below, some US authors use the 10% trap value as a warning threshold. In our area of interest, the threshold is passed on average on 25 June, which is about 20 days before the peak of the infestation.
In the area of interest, PJ has only one generation per year, according to this source and this one.
A note on the environmental conditions in 2023-2024
Since the flight period of PJ is very short, just 56 days as per the table above, the insects spend most of their lives underground in different larval forms.
The 2023-2024 winter season encompasses most of the subterraneal life of the PJ eggs deposited during the 2023 outbreak. Rainfall was unusually abundant compared with previous seasons, but temperature was high, virtually frostless10, in line with other recent winters11. I had hoped that the well above average rainfall would negatively affect Popillia larvae, but that did not happen.
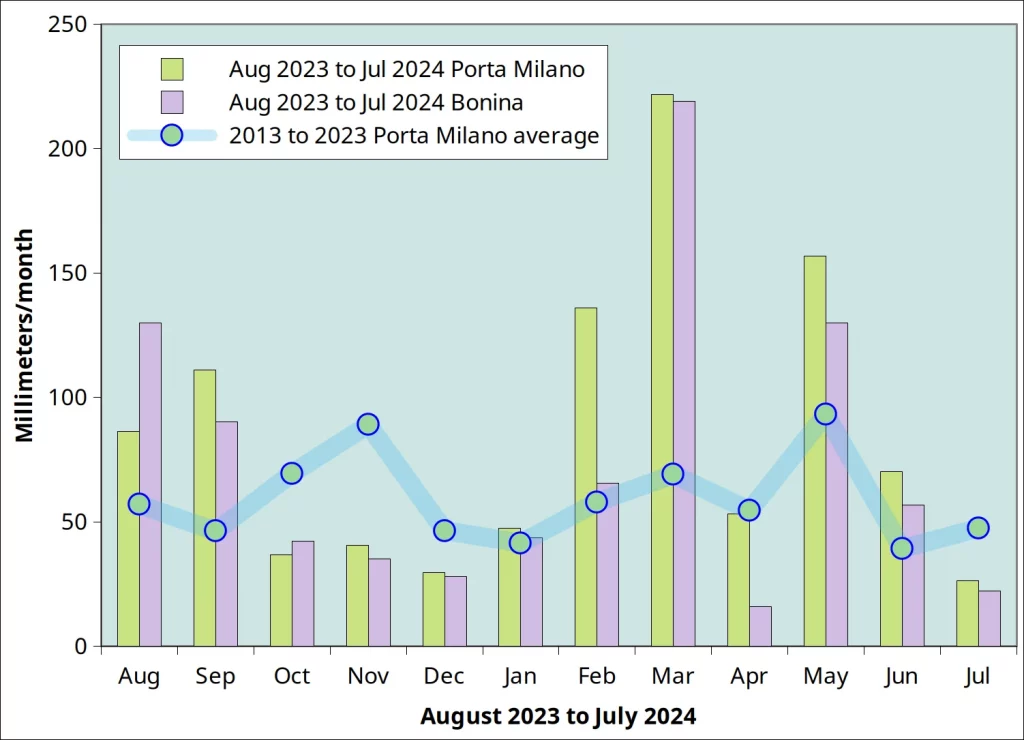
Figure 5 shows precipitation in the two non-professional stations of Casale Porta Milano and my own Camagna-Bonina station13 which is located about 30 m from the staircase depicted in Figure 1. Porta Milano was included because the station has some historical data which are not available for Bonina. Note14 has some comments about the acceptability, and even the desirability of short reference periods (2013-2023) for agricultural applications.
With the exception of February 2023, the behaviour of rainfall appears to have been very similar in the two stations of Porta Milano and Bonina: higher than average precipitation in August, September, March and May, and relatively dry fall and early winter, and July. But the main departure was March with about 200% excess precipitation. As mentioned, this did not significantly or visibly affect the 2024 outbreak. It may even have favoured emergence in an area of predominantly hard cracking clay soils.
The dynamics of my 2024 Popillia outbreak
Table 2 provides some numeric information about the outbreak. As this was largely unplanned, the sampling leaves a bit to be desired. For instance, the early and late stages should have been assessed more carefully by sampling at regular time intervals, for instance every two days.
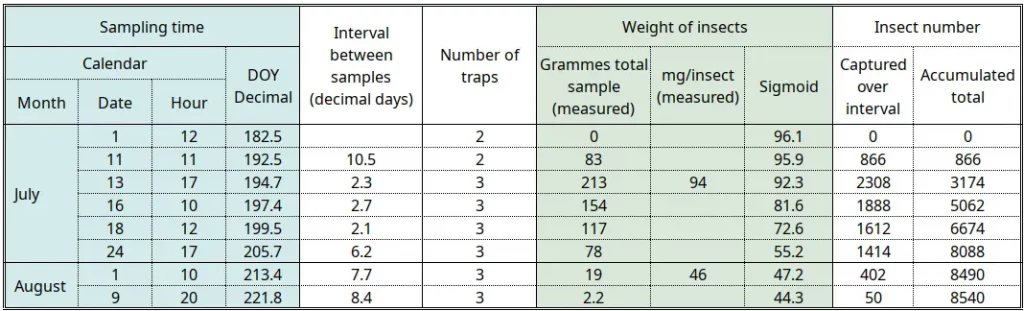
A major methodological issue is the fact that the insects visibly became smaller as the outbreak developed, and I am still not clear what this is due to. A first count and weighing on 13 July yielded a weight of 94 mg per insect, but the late sample yields only 46 mg. Sex possibly plays a part as males are smaller than females. According to the information leaflet (scheda_popillia_japonica.pdf) issued by the Piedmont Region in 2015, insect size varies (length: 8 to 12 mm, width 5 to 7 mm) but sex is determined according to leg anatomy; my simple 12x botanist’s hand lens was insufficient to determine the sex of the insects).
Perhaps the insects from the beginning of the outbreak fed elsewhere before being caught, while the latter went straight into the traps? This seems unlikely as the growth of the insects’ chitin exoskeleton requires moulting. It is more likely that the last Popillia were born small, perhaps in relation to the unusual environmental conditions.
Since the number of insects was determined by weighing, I had not foreseen that insects would “shrink” over time and a very empirical approach had to be adopted based on the two above-mentioned weighings, as explained in the note15.
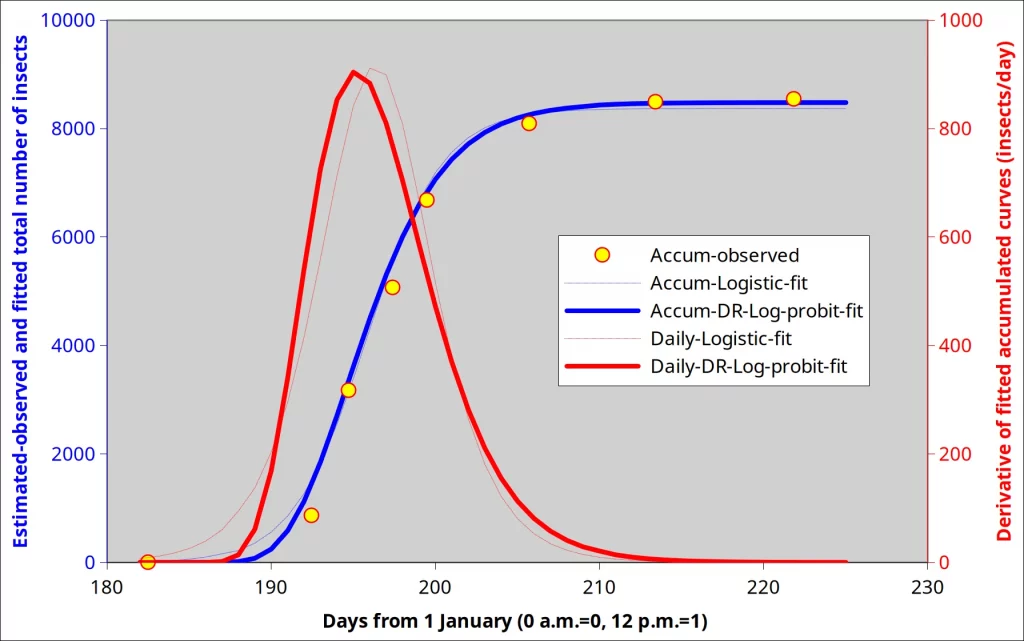
The accumulated total number of insects in the last column of Table 2 was fitted by a Dose Response log-probit sigmoid (3 parameters) shown in Figure 6 using Curve Expert Pro version 2.6.5. The derivative of the accumulated curve (heavy red curve) provides the number of insects captured on a per day basis. The peak occurred on day 195 (13 July, 904 insects per day). This is two days later than the peak observed by Gilioli and his colleagues and in the eastern part of the region. 13% catch was achived on day 192 (10 July), 53% on day 196 (14 July), 91% on day 202 (20 July) and 99% on day 209 (27 July)16.
Sums of degree days
In my lectures notes to the WMO-FAO Roving Seminar on Crop-yield Weather Modelling available on the website of FAO (page 28, Chapter 2.3.2 on Phenology; page 117, Excercises 7.5, Sums of temperatures; determination of cardinal temperatures) I insist on the criticisms that may be addressed to Sums of degree days (SDD) as a tool to “forecast” phenology17.
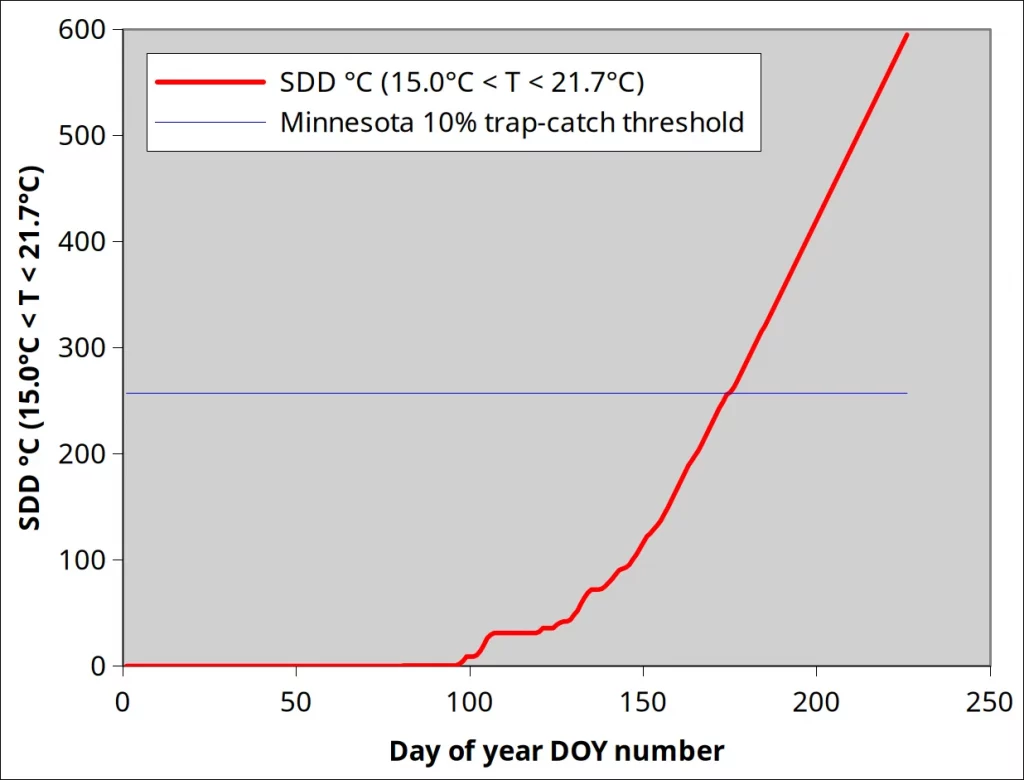
Yet, it must be recognised SDD remains amazingly effective and easy to implement. Ebbenga et al., (2022), applying the approach of Hanson et al. (2015) have achieved good results with Popillia japonica in Minnesota and suggest their approach can be applied to the broader context of the Midwest. They estimate 10% trap-catch and warn the farming community when the value is reached, as there is still sufficient time to install the traps and capture the bulk of insects. They compute SDD as the sum of Te (“effective” temperature) for each day, starting from January 1st (d=1). If the daily average temperature18 T is below 15.0°C, use Te=0°C, otherwise use Te=T-15.0°C. If the average exceeds the upper threshold of 21.7°C, use Te=21.7-15.0=6.7°C. 10% trap-catch is achieved when the sum of daily Te (i.e. SDD) passes the threshold of 257 degree-days °C. The authors state that the model can also forecast a reasonable estimate of beetle trap-catch at 25%, 50% (peak), 75% and 90%, for degree days of 298, 346, 401, and 465 (°C), respectively.
According to Figure 7 and Minnesota reference data, 10% trap-catch (SDD=257 day°C) would have been reached on day 175, i.e on 23 June. 50% and 90% catch would have been reached on 7 July and 25 July, respectively. The values are off (early) by about one week.
It remains that the SDD approach, because of its simplicity, could easily be implemented in Piedmont as a warning system19, at a very low cost and based on existing products. It would be easy, in addition, to issue crop-specific warnings.
Conclusions
My garden in Bonina, municipality of Camagna Monferrato in the Piedmont region is well within the major infestation area of Popillia japonica in Italy. Five-leaved ivy (Parthenocissus quinquefolia), Laurustine (Viburnum tinus) and two Cotoneaster species suffered extensive defoliation by Popillia japonica 2023, but were efficiently protected by three traps in 2024. In the two years, the damage was circumscribed to the same area of about 100 m² where about 20 other woody and herbaceous (Nepeta) plants were not harmed.
In 2024, the outbreak was monitored. It started by early July and had subsided by mid-August; it does not seem to have been afffected by very significant precipitation in March and May, coinciding with late larval stages before pupation. The virtually frostless winter may have favoured the insects. The trapped insects peaked on 13 July (904 insects/day) for a total of 8540 insects over the season.
It is suggested that, after proper calibration, simple sums of degree-days may provide an unexpensive and efficient warning tool.
There are two unexplained observations in this post: (1) Why were the outbreaks so limited spatially and why were only four species attacked and (2) Why did the size and weight of the insects halve between the beginning and the end of the outbreaks?
References
Note: the most comprehensive and up-to-date information on Popillia japonica in Europe is available from the Horizon 2020 funded IPM Popillia EU project.
Ebbenga DN, Hanson AA, Burkness EC, Hutchison WD 2022 A degree-day model for forecasting adult phenology of Popillia japonica (Coleoptera: Scarabaeidae) in a temperate climate. Front. Insect Sci. 2, 11 pp. https://doi.org/10.3389/finsc.2022.1075807
Gilioli G, Sperandio G, Simonetto A, Colturato M, Battisti A, Mori NB, Ciampitti M, Cavagna B, Bianchi A, Gervasio P 2022 Modelling diapause termination and phenology of the Japanese beetle, Popillia japonica. J. Pest Sci. 95:869–880. https://doi.org/10.1007/s10340-021-01434-8
Gotta P, Ciampitti M, Cavagna B, Bosio G, Gilioli G, Alma A, Battisti A, Mori N, Mazza G, Torrini G, Paoli F, Santoiemma G, Simonetto A, Lessio F, Sperandio G, Giacometto E, Bianchi A, Roversi PF, Marianelli L 2023 Popillia japonica – Italian outbreak management. Front. Insect Sci. 3, 12 pp. https://doi.org/10.3389/finsc.2023.1175138
Hanson, A. A., Moon, R. D., Wright, R. J., Hunt, T. E., & Hutchison, W. D. (2015). Degree-Day Prediction Models for the Flight Phenology of Western Bean Cutworm (Lepidoptera: Noctuidae) Assessed with the Concordance Correlation Coefficient. Journal of Economic Entomology, 108(4), 1728–1738. doi:10.1093/jee/tov110
Paoli F, Iovinella I, Barbieri F, Sciandra C, Sabbatini Peverieri G, Mazza G, Torrini G, Barzanti GP, Benvenuti C, Stangi A, Bosio G, Mori E, Roversi PF, Matrianelli L 2023 Effectiveness of field-exposed attract-and-kill devices against the adults of Popillia japonica (Coleoptera: scarabaeidae): a study on duration, form and storage. Pest Manage Sci. 79: 3262–3270. https://scijournals.onlinelibrary.wiley.com/doi/epdf/10.1002/ps.7504
Poggi S, Desneux N, Jactel H, Tayeh C, Verheggen F 2022 A nationwide pest risk analysis in the context of the ongoing Japanese beetle invasion in Continental Europe: The case of metropolitan France. Front. Insect Sci. 2, 7 pp. https://doi.org/10.3389/finsc.2022.1079756
Smith BC 1966 Variation in Weight, Size, and Sex Ratio of Coccinellid Adults (Coleoptera : Coccinellidae). Canad. Ent. 98: 639-644
Ulrich W 2007 Body weight distribution of central European Coleoptera. Eur. J. Entomol. 194:769-776.
Notes
- They were commercialised in Italy in 2024 as Popiltraps, with a well done and informative leaflet, at just under 40 Euro per trap. This will make you understand why they don’t commercialise Leptinotraps (Colorado potato beetle traps). ↩︎
- Amoung the 8000+ Popillia beatles I eventually caught in the traps, there was also one Rose chafer, a close relative of the White spotted rose beetle. The chafers belong to the very large family of the scarabaeidae, the same as Popillia. ↩︎
- Of course, I have no way of guessing which percentage of the insects of the local population I caught, nor whether the concept of “local population” is even meaningful. ↩︎
- My concept of a garden is a mix of local, wild plants with some cultivated ones. Some passages in the “wild” areas are nevertheless mowed regularly to maintain easy passage. This is very much in line with the approach of Douglas Tallamy and his Home grown national park initiative.
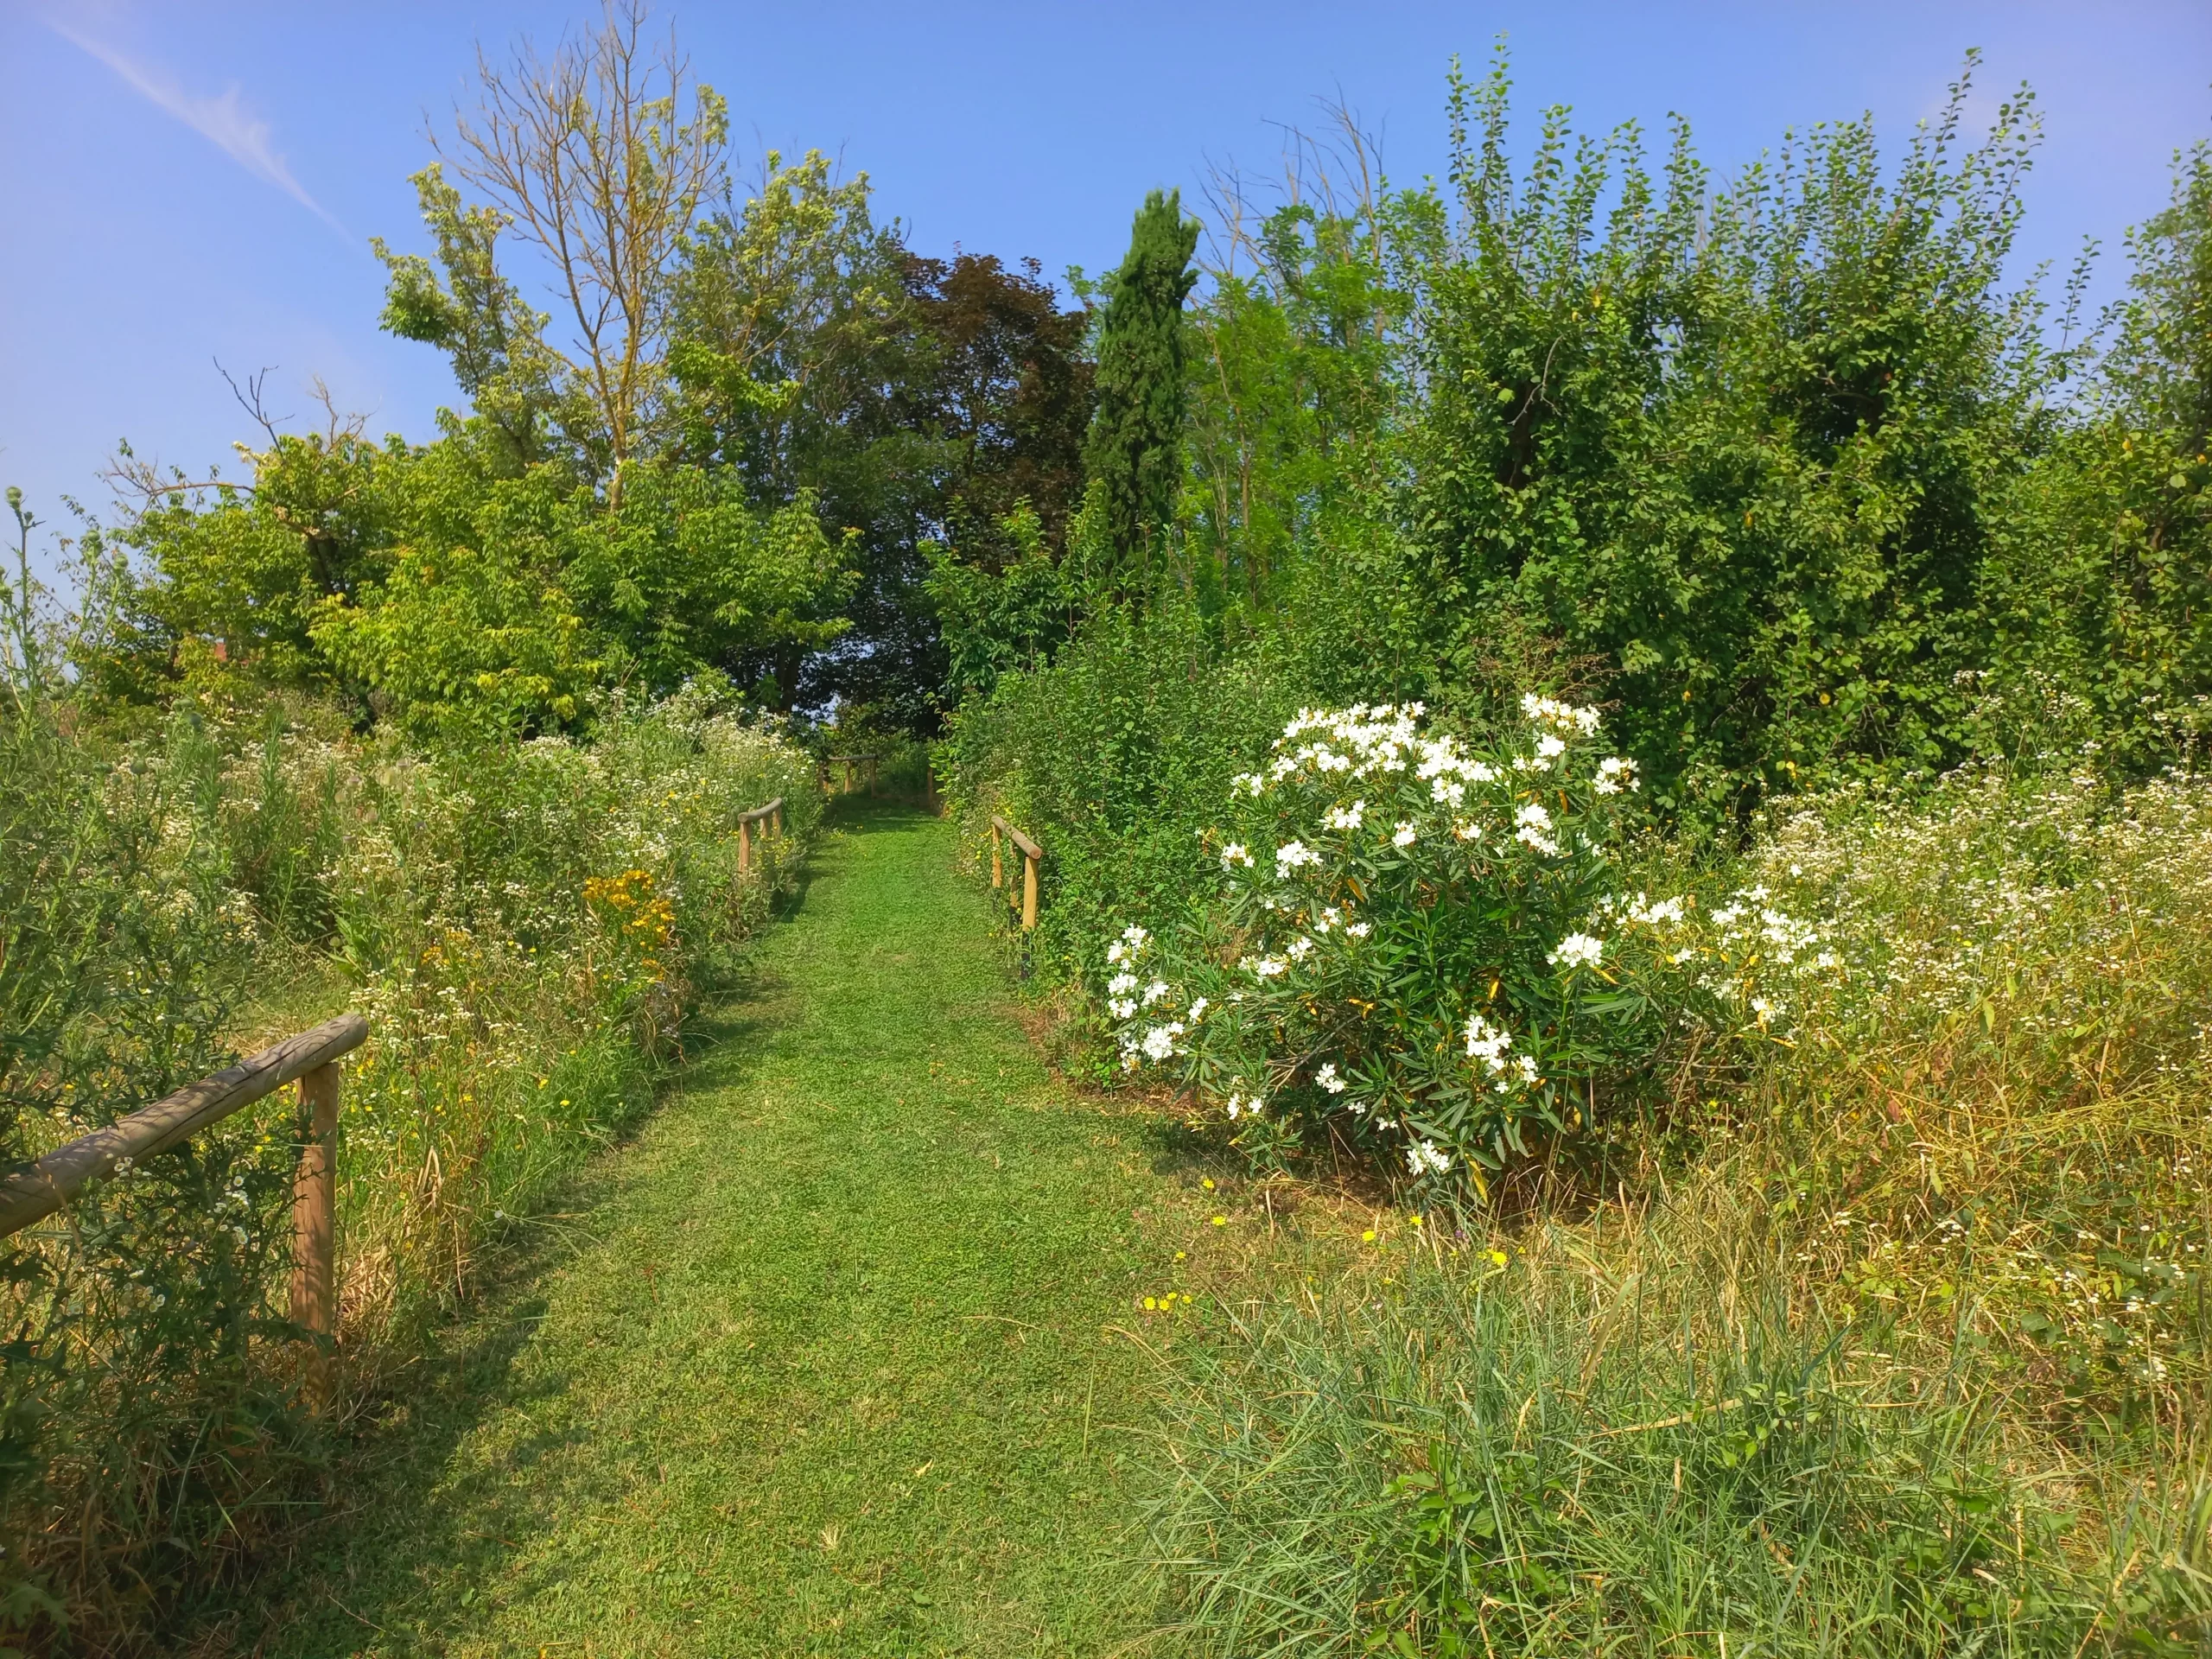
Figure Note 4: a typical view if the garden with a maintaned (mowed) “road” leading to some trees. The staircase is about 20 m beyond the trees. Wild vegetation is free to grow on either side of the “road”. Photo taken en 2024-07-17.
↩︎ - This observation is not completly ridiculous, as the stair is probably the most protected part of the area. Paoli et al. (2023) note that Popillia activity is inversely correlated with relative humidity; however, there was no correlation with average temperature, wind speed, solar radiation, and atmospheric pressure. Because of “the concrete” the area of the staircase may be dry, but nevertheless protected from wind. ↩︎
- I should mention that there may be some damage in my (unirrigated) “lawn”, which is just the pompous name of the limited part of the garden where the vegetation is maintained short with a grassmower. The “lawn” is made up by many Asteraceae (especially the dandelion type with basal leaves), Setaria sp., Cynodon dactylon, Plantago spp., Convolvulus and that other member of the Convolvulaceae, Dichondra sp., Euphorbia prostrata, some actual “lawn grasses” (Poa, Lolium…), Verbena, Chenopodium… In 2024, probably due to the abundant rainfall, there were some Carex in spring. Over the season, there is a succession of clover species (Trifolium repens, campestre, pratense etc). I have the impression that there are more empty patches in the lawn due to Popilllia feeding on Trifolium. But this is just an impression that I shall try to confirm in 2025. ↩︎
- The assumption is probably that Popillia will prefer human intellectual categories and recognise “groups of taxonomically related plants”. This website of the European IPM Popillia consortium maintains a list of known host plants in Europe. ↩︎
- This includes several types of plums and cherries. It could be that we have a phenomen similar to what happens with cherries: they need not to be protected against birds, contrary to what happens in many other areas. Birds feed on wild cherries and leave the domestic ones to be harvested by their owners! Could it be that Popillia feeds on wild Prunus and causes little harm in domestic ones? ↩︎
- The Po valley is one of the most heavily polluted areas in Europe: air, soil and the waters. Refer to the Guardian as well many technical sources. ↩︎
- Many basil seeds, which normally do not survive Italian winters, started growing in the spring of 2024! ↩︎
- Temperature readings at Bonina station during early 2024. Ten frost days occurred between 12 and 30 January, with the lowest minimum (-2.5°C) occurring on 13th (day 13), 21st (day21) and 30th (day 30). A relatively cool spell occurred from days 114 (21 April) to 118 with minima between 3°C and °C.
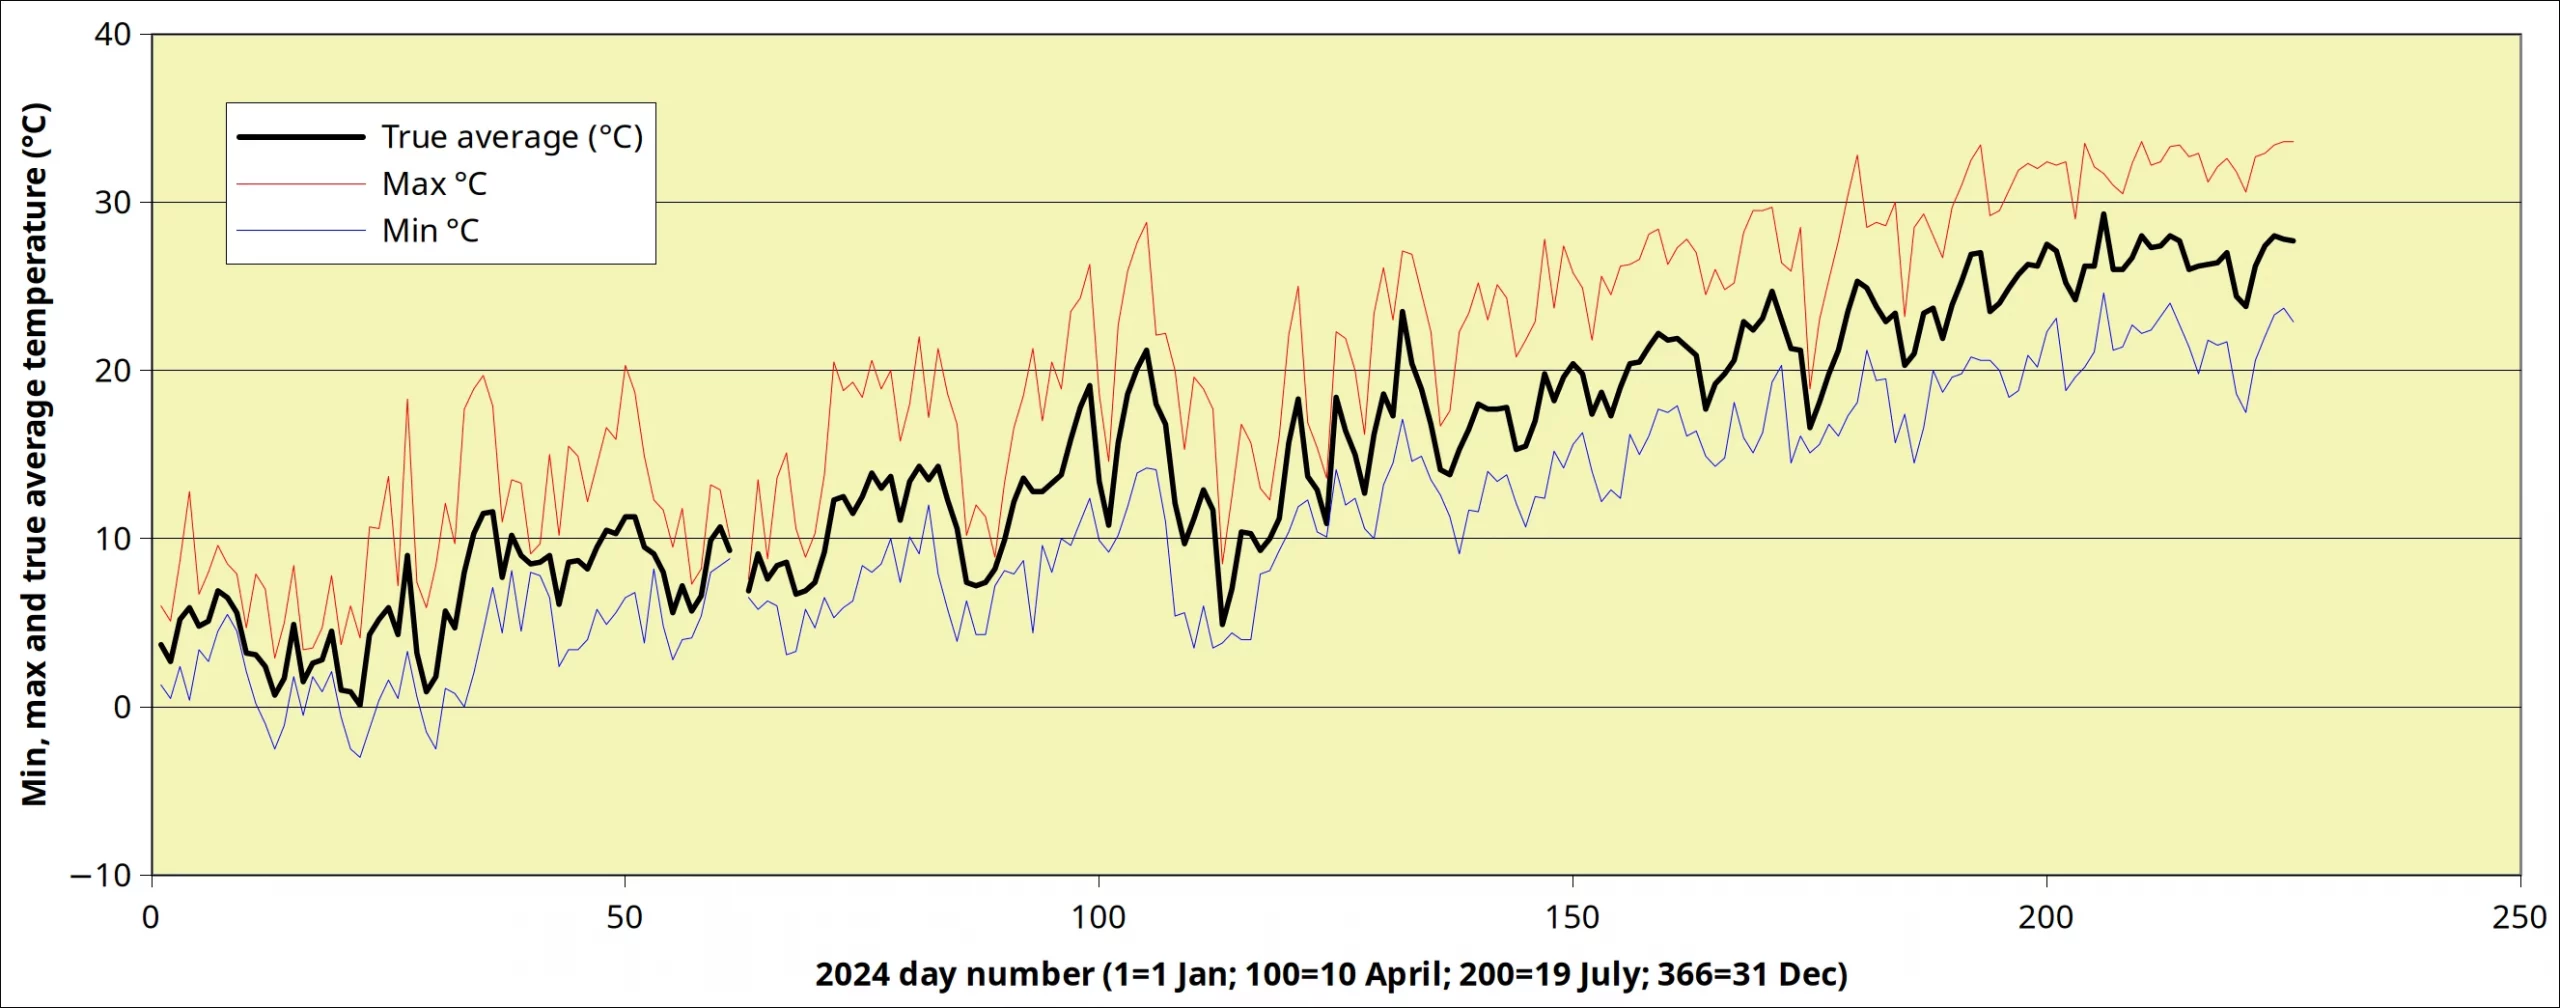
Figure Note 11: extreme temperatures at Bonina wether station. Temperatures are recorded every 10 minutes and the value listed as “true average” is the usually the average of 143 readings. 2 March (day 62) is missing altogether, as are some other individual readings. On average, 136 readings are available per day. ↩︎ - The Porta Milano station is located at 45.13° N, 8.47° E at an altitude of 116 m. Data were downloaded from the site. Bonina station is at 45.03° N and 8.44° E at 181 m. ↩︎
- This is a Bresser 7-in-1 station that has been in operation since August 2023. ↩︎
- I have frequently argued that the 30-year reference period for climate data, which climatologists religiously stick to, is often meaningless under climate change conditions. In fact – and this is elementary statistics – averages are meaningful only if the data being analysed are stationary, i.e. devoid of trends. Samples with a population of N=30 were invented by statisticians, and adopted by climatologists. As the reader is probably aware, climatologists refer to normals (30-year period averages) and standard normals (specific reference periods such as of 1961-90, 1991-2020, etc). We read in January 2024 that NASA Analysis Confirms 2023 as Warmest Year on Record, and all recent years broke the previous temperature record. Clearly, using old reference data of from 1991 to 2000 in our analyses is meaningless. When dealing with agriculture, a proprer reference period would be one that is recent (not exceeding 15 years) because earlier years definitely do not describe current conditions. In addition, farmers adapt to the ongoing changes to the extent that recent practices often depart significantly from earlier practices. This applies as well in crop monitoring where I have repeatedly advocated short reference periods of 12 or 15 years (point 8). This is also the approach of CropWatch, the Chinese global crop monitoring initiative. Therefore, I do consider that the 11 years reference in the figure is an aceptable and meaningful reference period. ↩︎
- I assumed that “full size” Popillia occurred at the beginning of the outbreak, and then approximately linearly decreased towards the end. An impressionistic Weibull sigmoid was forced through the data resulting in the figure below. Average weights at intermediate times (third column from the end in Table 2) were determined from the sigmoid.
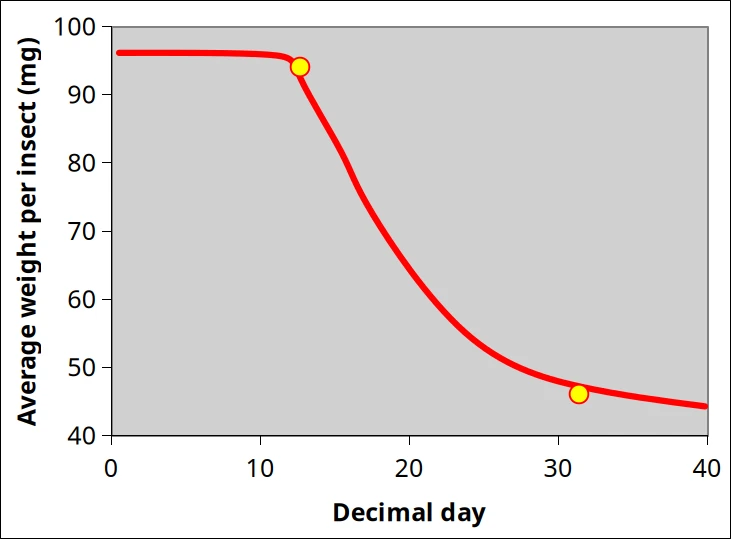
Figure Note 15: impressionistic sigmoid accounting for the decreasing weight of popillia between early and late outbreak.
There seems to be little information available about the weight of Popillia and I am somewhat surprised that modelling attempts do not adopt a more ecological approach, which would include beetle energetics, food type etc. At the very beginning of this work, I tried to guess Popillia beetle weights using analogies and empirical formulae (Smith, 1996; Ulrich, 2007) and adopted a provisional weight of 45 mg, somewhere between a ladybug (20 mg: https://www.animalspot.net/ladybugs) and a cockchafer (Melolontha melolontha) which is said to weigh 200 mg. I was also surprised to read that the weight of the Colorado potato beetle varies a lot: from 50 to 170 mg. Clearly, weight variations in Popillia are no exception. ↩︎ - Integer percentages are achieved on fractionnary days! For instance, 10% catch would be achieved on day 191.483, between 11 a.m. and noon on 9 July . ↩︎
- There is also a French language version, which I could make available upon request. ↩︎
- Sum of degree-days computations typically use the average of daily maximum and daily minimum temperatures as the average daily temperature. When daily temperature development follows well-behaved patterns, this is usually acceptable. In the case of 2024 Bonina data, the graph of (Tx+Tn)/2 agains “true” average is shown hereafter.
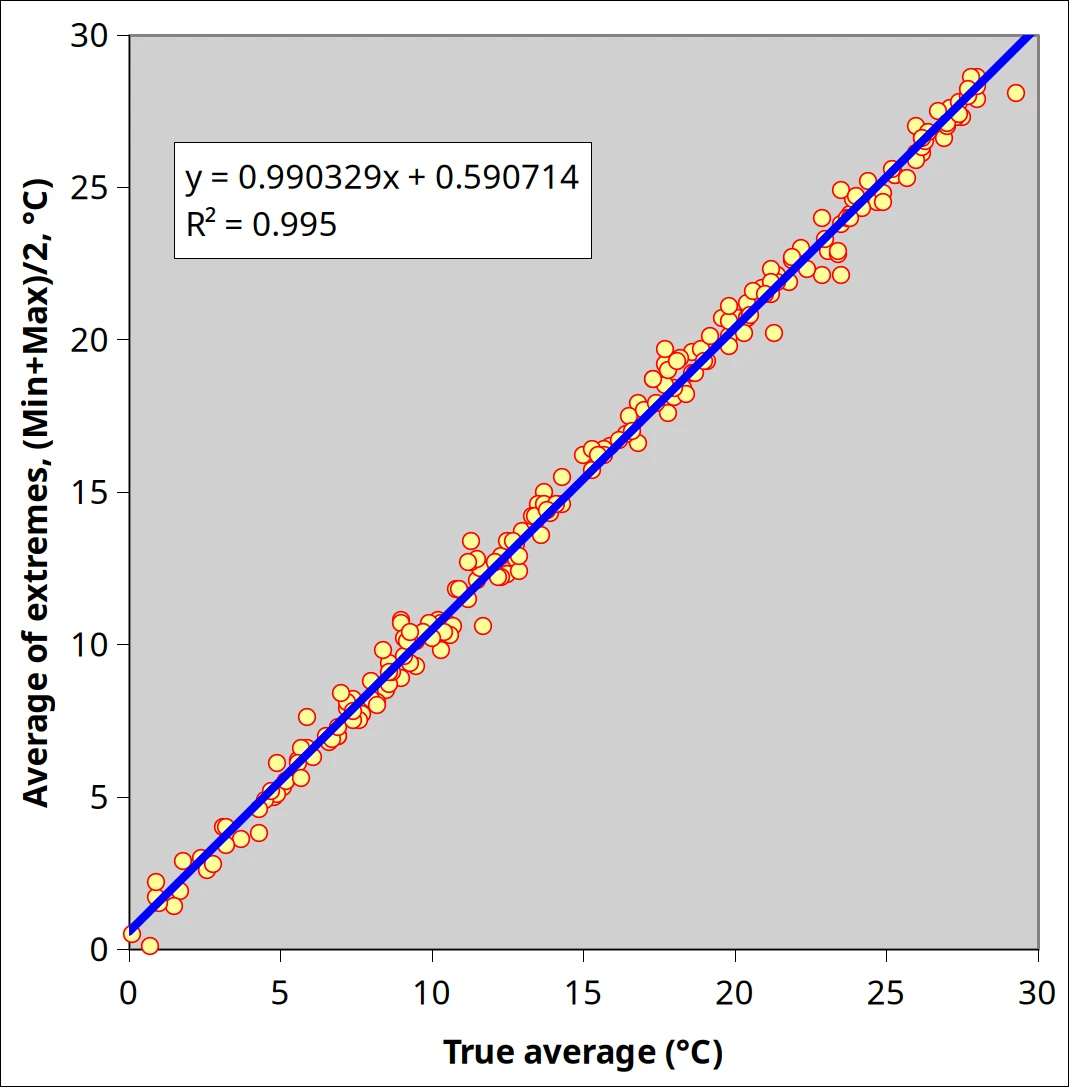
Figure note 18: Average of extreme temperatures vs. “true average” (readings every ten minutes) at bonina weather station during the first half of 2024.
Although the correlation is excellent, the average of extremes overestimates the true average by about 0.6°C at 0°C. ↩︎ - Calibration data are plentiful, and the spatial mapping of temperatures is easily done. ↩︎
After discussions with colleagues, we also have observed the phenomenon you describe over the years: we have found that the adult Popillia insects caught in our traps during the summer season are smaller in size than those caught at the beginning of the season (see e.g. the attached photo). We are not aware of any scientific studies analysing this phenomenon, but one hypothesis is that the smaller size could be linked to the fact that the late larvae, feeding in a different way to the earlier grubs, give rise to more stunted adults.
With regard to weight, it emerged from our observations that it is very much influenced by the weather conditions at the trapping site, in particular the humidity level. In fact, a dry climate favours weight loss in individuals and, on the contrary, a high humidity rate increases it. This is why, for counting individuals in the traps, we use the volumetric unit and not the weight (considering an average Popillia adult weight of 0.12373 g and a conversion factor with cm of 1119.1 adults per cm).
You may possibly, in next summer’s monitoring, record not only the differences in weight, but also those in volume of the adult insects you catch in your traps.
Paola Gotta
REGIONE PIEMONTE
Settore Fitosanitario e servizi tecnico-scientifici
Dear Dr Gotta,
Many thanks for your kind comments. I shall certainly follow your advice and record the differences in volume of the insects and, generally, do a better job in sampling. Let me note, however, that the difference in size between the first Popillia and the last ones was much more marked in Camagna than in the photograph you attach. The insects captured at the end of the outbreak were only half the size of the first ones, and not much bigger than a large ladybird! You indicate a weight of 124 mg per insect, while the “heaviest” Popillia I weighted were at 94 mg, i.e. about 25% lighter than your reference weight. I don’t know if this is of any theoretical or practical interest, but it seems obvious that “large” insects eat more than “small” ones.
I couldn’t agree more with your view in note 14 that the reference period for climate data has to be shortened if it is to be meaningful in agricultural applications. You may be interested in a recent article in The conversation where the author suggests that Currently there is no single alternative definition to the traditional 30-year climate normal, given the variable impacts across the planet. Each region will need to determine its own relevant climate time period definition.
Hello Rob!
Thanks for your comments & nice to hear from you.
Climatologists are indeed a stubborn species and many of them see the statistics before the reality.
There is a famous example in my country (Belgium) of a renowned climatologist who published dozens of papers on (colonial) Congolese climatology but had never set foot on the African continent. He was an unconstested authority on Congolese climatology but more than anything else, he was an expert in statistical number crunching. Statistics is dogma but the immutable and inflexible attitude of climatologists regarding 30-year reference periods is bound to change at some stage. Fortunately nothing prevents us who deal with environmental-biological (including agriculture) from adopting operationally more realistic refernce periods.
I noticed that you truncated the quote from The conversation in your comment. The original says Each region will need to determine its own relevant climate time period definition – and machine learning tools can help.
The reference to machine learning makes sense as it appears that a lot of flexibility will be needed to replace the stubborn 30-year reference period. You may have seen the very recent paper by Kornhuber, Bartusek, Seager, Schellnhuber and Ting in PNAS on Global emergence of regional heatwave hotspots outpaces climate model simulations. It appears that spatial patterns of “global warming” are complex and, therefore, it may not be so easy to adopt universally acceptable climate yardsticks.