
EMIG.1 Introduction
The purpose of this post is specifically not to provide a detailed analysis of emigration out of the Project area. Instead, its specific purpose is to try and identify some patterns that may be of help when interpreting the fluctuations of the number of weddings as they appear in chapter WEDNUM. This includes (1) absolute numbers of migrants in order to decide if the numbers were sufficient to affect the fluctuations of the number of weddings and (2), if the numbers were sufficient, to see if the emigration peaks somehow coincide with drops in the number of weddings. Accessorily (3) to asses some more qualitative points such as differences between sexes that may have affected the distance from which spouses originate. For instance, it was noted in chapter RELOR (Table RELOR-T04) that clusters 1, 2 and 4 have a relative excess of brides over grooms, which could be due to more males than females emigrating.
EMIG.2 Emigration data sources
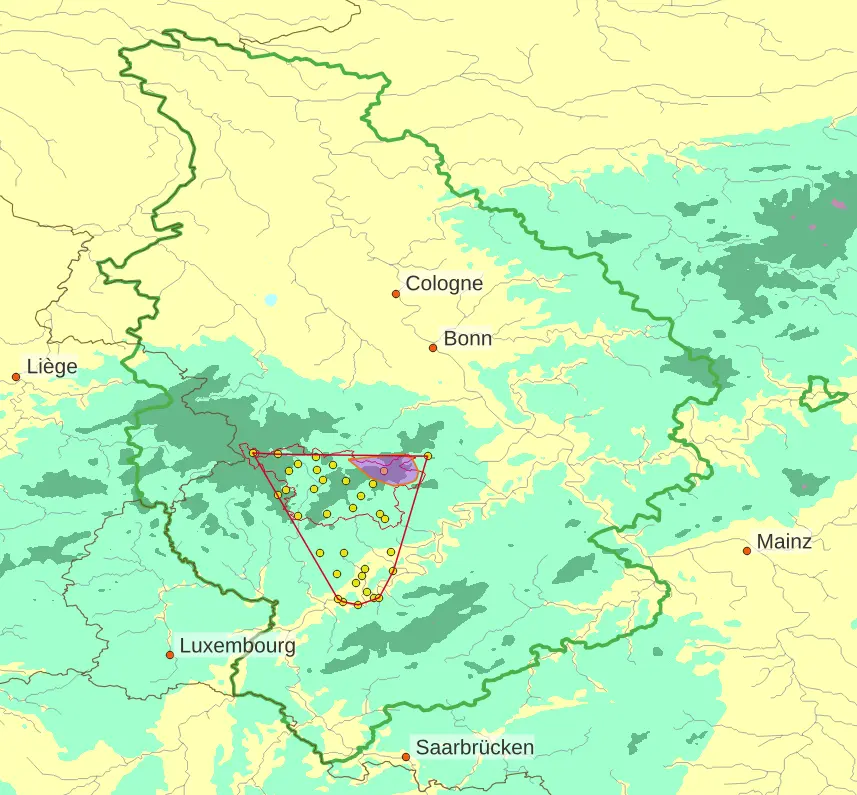
The graphs below are based on several easily available quantitative data sources, foremost the database of emigrants from “Rhineland” which is available from the Archives of North-Rhine-Westphalia under the title Sachthematisches Inventar: Auswanderer aus dem Rheinland (19. Jahrhundert, Findbuch 211.22.01). The database includes about 58200 people who emigrated from Rhineland between 1814 and 1939. See figure EMIG-F01 for a delineation of Rhineland with some other areas. It is not known to what extent this and other sources of migrant data are comprehensive. There are some obvious errors and duplications due, for instance, to misspelled locality names, as is usual in historical archives. In addition to the Sachthematisches Inventar: Auswanderer aus dem Rheinland, this chapter draws information from a detailed local inventory of migrants assembled by Helmut Pauly und Karl-Josef Tonner for the northern part of the Project area (after 1840, basically clusters 1 and 4). The databases are available on the website of KJ Tonner for the area of Kelberg and on the site of the municipality of Kradenbach for the data assembled by Pauly. The mentioned areas are illustrated in figure EMIG-F0E1. The combined Tonner and Pauly data bases, after the usual corrections, include 6789 emigrants from 149 localities. Some (e.g. Gunderath, 50.25675°N, 6.978124°E) had to be added in the FC file (chapter DATA.4) where they are identified as TP.
EMIG.3 Rhineland emigrants
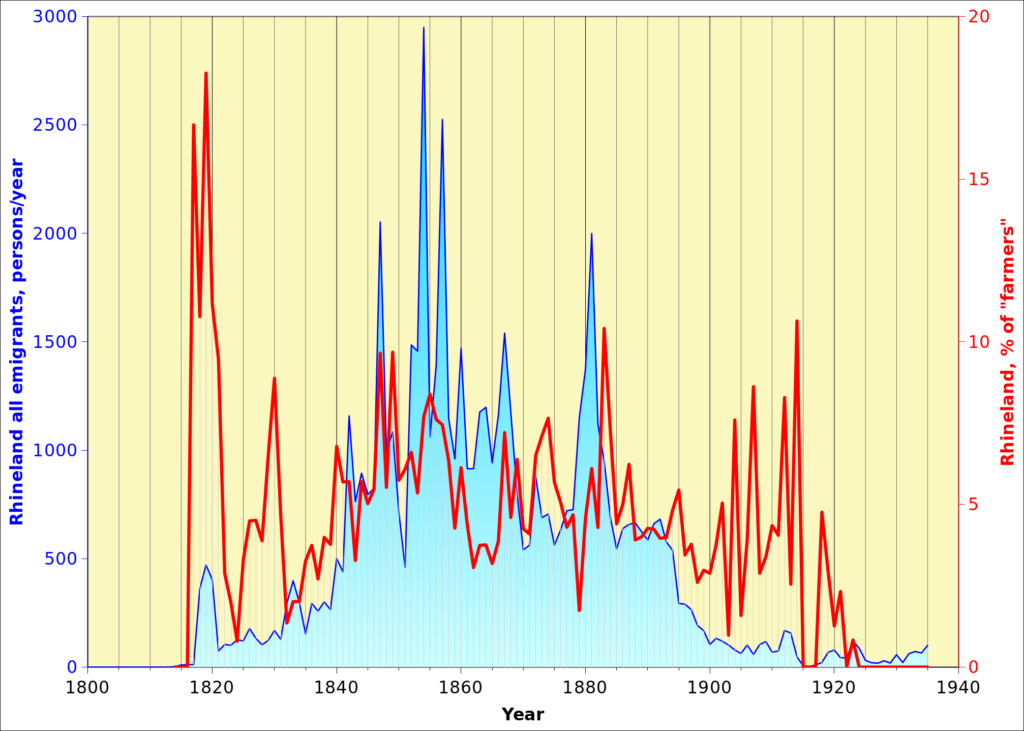
The number of emigrants from Rhineland according to the Sachthematisches Inventar: Auswanderer aus dem Rheinland are shown on an annual basis in figure EMIG-F02. As mentioned above, they reach about 60000 people. Peaks occurred from 1818 to 1820 (1236 people left), 1832 to 1834 (990), 1842 (1158) , 1847 (2052), 1852 to 1857 (10869) with the absolute peak in 1854 (2949), 1860 (1469), 1863 to 1868 (7192), 1879 to 1883 (6591), after which emigration declined. The population of the Project area reached just above 67000 people in 1885 (refer to chapter WEDNUM) at a time when the population of the Rhineland Province was just above 2 million, i.e. the project area represented about 3% of the total population of Rhineland. It is further stressed that the Project area is much less densely populated than the more developed northern areas of the province, although it may be that, due to poverty and precarious living conditions, the Eifel underwent more intense emigration than other areas. It remains that, if the percentage of 3% applies, emigrants from the project area would be around 2000. The number of emigrants between 1818 and 1935 from the Registry Office localities that are mentioned in the Sachthematisches Inventar: Auswanderer aus dem Rheinland amounts to 2521. For 90 of them their profession is indicated; 28 are related to agriculture and 15 were outright farmers.
EMIG.4 Farmer emigrants from Rhineland
Keeping in mind that unfavourable weather mostly affects “farmers” an attempt was made to evaluate the number of people active in the agricultural sector. Professions are not indicated for all migrants, but only for about one third of them, i.e. 22000. Numbers of “Agricultural migrants” were estimated (1) in a very broad sense to include all those whose livelihhoodsmore or less depends on crops, animals and woodlands; “Agricultural migrants” in a more narrow sense are those who declare their profession as farmers.
Agricultural emigrants in the broadest sense include the following: Farmers, farmhands, garderners, winegrape growers, gardeners and garden workers2 plus some others involved in the production of wine, bier and spirits3 as well as blacksmiths4, barrel makers5, sheep herders and people involved with sheep and horses6, “forest workers” as well as millers, pastry and bread bakers7. There are also women8 and a long list of aides and apprentices of various levels9. Finally, there is a large number of people who declare two professions, such as farmer and cartwright10, farmer and velvet weaver11 and many other combinations; they were counted only once.
Agricultural emigrants that originate in Rhineland in the broadest sense amount to 4448 (22%), i.e. about one fifth of all migrants with a declared profession. Farmers in the strict sense are 3588 (18%), i.e. about 81% of all agricultural migrants. There is a large group of day labourers12. Day labourers were mostly poor and landless. According to Wikipedia they usually did not have any specific occupation and basically accepted any casual and seasonal work. Although it can be assumed that, in the context of the Rhineland province most day labourers worked in the area of agriculture, they were not included in the counts.
Figure EMIG-F02 shows the percentage of “farmers” in the strict sense; their share remains usually low, about 5% on average, but their migration patterns did not always coincide with the total. To start with, the pattern is affected by large fluctuations, which tend to be largest when the emigration numbers of the general population are low. The first large wave occurs from 1817 to 1830, with two peaks in 1819 (18%) and in 1829-1830 (7% and 8%). A second series of peaks out of phase with the general pattern occurs between 1904 and 1914 with the highest values in 1904, 8%; 1907, 9%; 1912, 8% and 1914, 11%.
EMIG.5 Pauly-Tonner data for Clusters 1 and 4

As mentioned, the Tonner-Pauly database covers exactly clusters 1 and 4, for which it can be assumed that most emigrants were somehow active in the area of “agriculture”. From 1840 to 1932, their total number reaches 6789. in section EMIG.3 above, the guess of about 2000 was proposed for the number of migrants from the Poejct area, a more than threefold underestimate according to the Pauly-Tonner data, indicating that emigration was relatively more intense than in remaing areas of the Rhineland Province. In addition, consider that the Pauly-Tonner database does not include the whole Project area. Also note that, as mentioned, there is no indication about the completeness of any of the databases. For instance, it should be relatively easy to verify which share of the Pauly-Tonner data do occur in the Sachthematisches Inventar: Auswanderer aus dem Rheinland. However, as indicated at the outset, our purpose in this Chapter is just to identify some dominant features of relevance to chapter WEDNUM and the matter was not further explored.
The time series of Pauly-Tonner migrants includes peaks which very clearly coincide with the peaks of farmer emigration for the Rhineland province as a whole, with high values between 1841 and 1846 (peaks in 1842-43 and 1846, the absolute maximum), 1852 and 1857 (with peaks at the beginnimng and the end), two peaks between 1866 and 1872 (highest value in 1868) and finally between 1880 and 1884. With exception of 1846 (clusters 1 and 4) and 1847 (Rhineland province), the emigration peaks coincide exactly in the two series, indicating, either that most Rhineland emigrants originated in the Project area (which is contradicted by the numbers in EMIG-F02) or that the same factors have driven emigration across aver large area, for instance the potato blight in the mid 1840s.
EMIG.6 Sex and age of emigrants
The Archives’ of North-Rhine-Westphalia database of Auswanderer aus dem Rheinland includes just under 48000 (47997) records in which the age and the gender of emigrants is available. The sex is either given directly13 or it can be inferred based on the First name14. Again, it is not clear whether the maiden name is given for all married women.
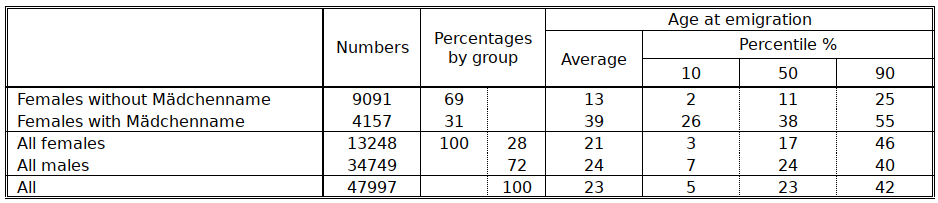
According to Table EMIG-T01 males made up about three quarters of all emigrants; among women, 31% were married. This would mean that only about 9% (31% of 28 % percent) of migrants were married women, with an average age of 39. The average age of males, on the other hand, was just 24. The average age of females without a maiden name, presumably girls and young women, was just 13. This seems to descibe a situation where most emigrants were young men, mostly unmarried, as well as families with children. This situation may have contributed towards creating a relative excess of brides, as already mentioned above (chapter RELOR (Table RELOR-T04). Note, incidentally, that age distributions are very symmetrical (median and average almost identical).
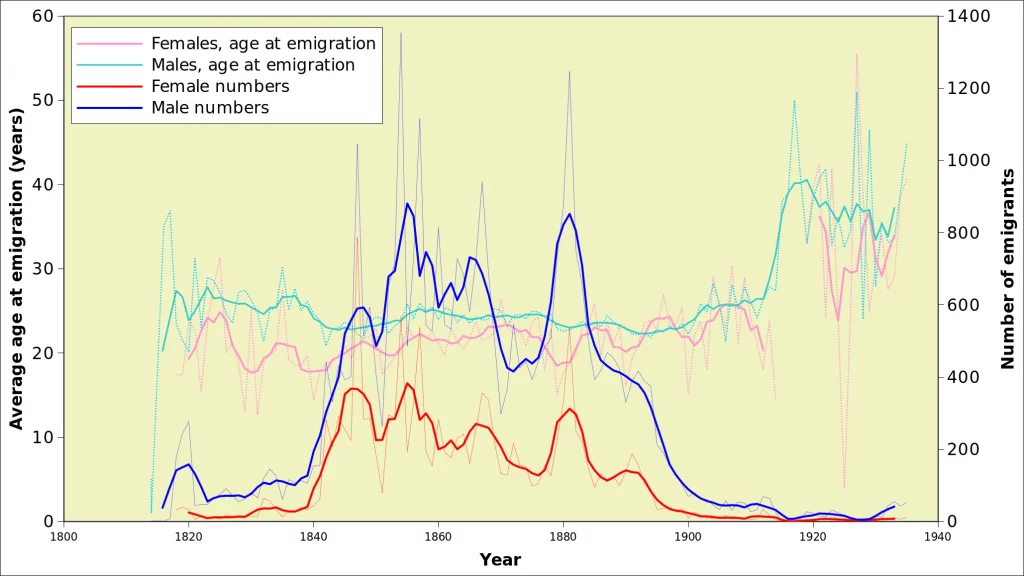
Figure EMIG-F04 illustrates gender-based variations of Rhineland emigration. There is a remarkable parallelism between the curves illustrating numbers, with women representing about one third of the numbers of men, as already shown in Table EMIG-T01. The age of emigrating males remained stable around an average of 24 years up to 1911, after which there was a sharp increase to ages of 40 and above from 1915. The age of women was about 3 years lower than that of males, but gradually increased to reach similar values after 1900. Their numbers dropped to zero from 1915 to 1928 and no ages are thus computed.
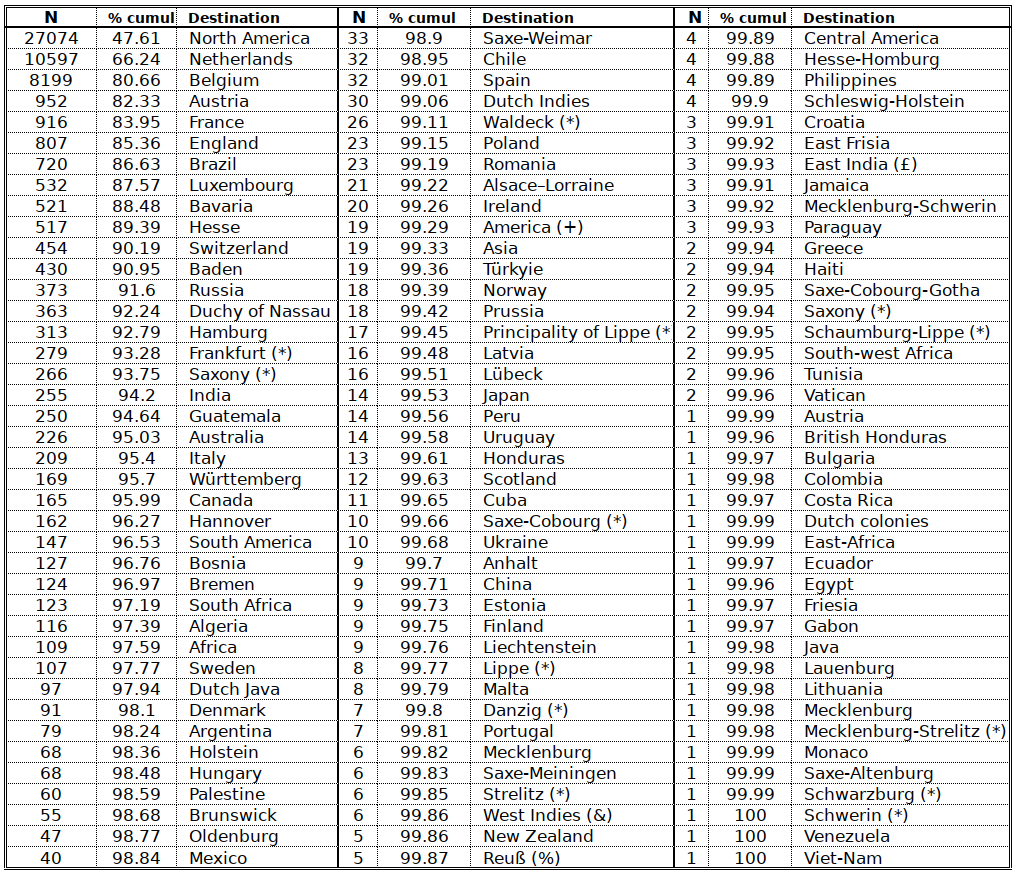
EMIG-ANNEX.1 Destination of emigrants
Although it is of little relevance for the present project, table EMIG-ANNEX.1-T01 lists the destinations of migrants as given in the Sachthematisches Inventar: Auswanderer aus dem Rheinland. Many of the listed destinations (countries) had deep historical roots but had reached the end of the independent political existence due to the political rearrangements of the 19th century.
EMIG-ANNEX.2 References
W. Köllmann, Bevölkerungsgeschichte 1800-1970, in: Handbuch der deutschen Wirtschafts- und Sozialgeschichte. Hg. H. Aubin u. W. Zorn, Bd. 2, Stuttgart 1976, S. 9-50, hier S. 10
P. Marschalck, Bevölkerungsgeschichte Deutschlands im 19. und 20. Jahrhundert, Frankfurt 1984, S. 27
- Needless to say, the Registry Office localities represent just 10 to 20% of all the villages in the Project area. Refer to variable Vill_num in table TYPOL-T01[↩]
- Bauer, Ackerer, Ackermann, Wirt, Ackerwirt, Landwirt, Knecht, Bauernknecht, Ackerknecht, Winzer, Gartenarbeiter, Gärtner, Kunstgärtner[↩]
- Destillateur, Weinhändler, Bierbrauer, Branntweinbrenner, Weinküfer i.e. cellarman[↩]
- Schmied, Hufschmied, Hammerschmied, Nagelschmied, Schmiedegeselle…[↩]
- Fassbinder[↩]
- Fuhrknecht, Gerber[↩]
- Müller, Müllerknecht, Konditor, Bäcker[↩]
- Weinhändlerin, Ackerin[↩]
- Konditorgeselle, Konditorlehrling, Ackerbauschüler[↩]
- Ackerer and Stellmacher[↩]
- Ackerter and Samtweber[↩]
- Tagelöhner, 1538[↩]
- For some married women the “Mädchenname” or “maiden name” is provided[↩]
- With extremely few ambiguous cases[↩]