The present chapter assesses how the occurrence of Eifel weddings is distributed over the year. Close to 40% of weddings used to take place during winter in the Moselle valley, while the effect was less marked in the volcanic Eifel of the north. The difference in tradition was completely cancelled during the first world war.
WEDWEEK-1 Seasonal variations in numbers of weddings
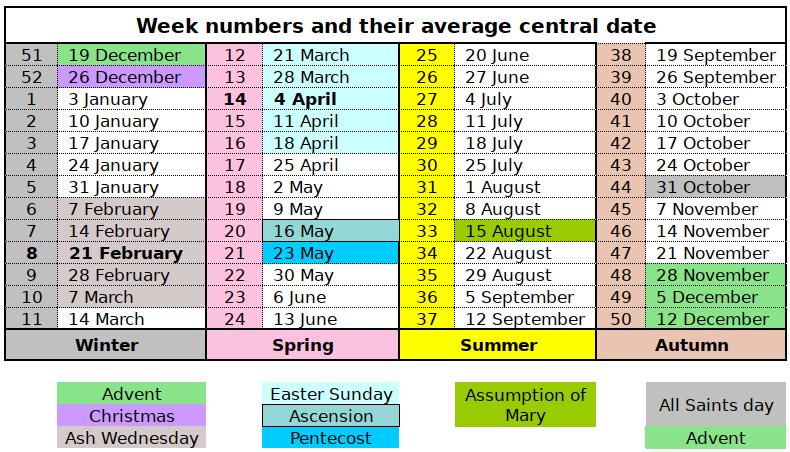
Wedding dates have been converted into week numbers. However, several approaches can be adopted to count weeks. Since we consider (Refer to chapter WEDDAY and this Wikipedia page) that weeks start on Monday, part of the first week sometimes belongs to the previous year. For instance, the 1st of January 1801 was a Thursday. Therefore Monday to Wednesday of week 1 fall in the previous year 1800. Week 2 goes from 5 to 11 January. Week 52 spans the days from Monday 21 December 1801 to Sunday 27 December. As a result, we have a week numbered 53 in 1801 between 28 December and 3 January 1802. All weeks numbered 53 have been ignored in the graphs and calculations below1. A table providing the correspondence between week numbers, their average middle date and religious occurrences is given as an appendix at the end of this post.
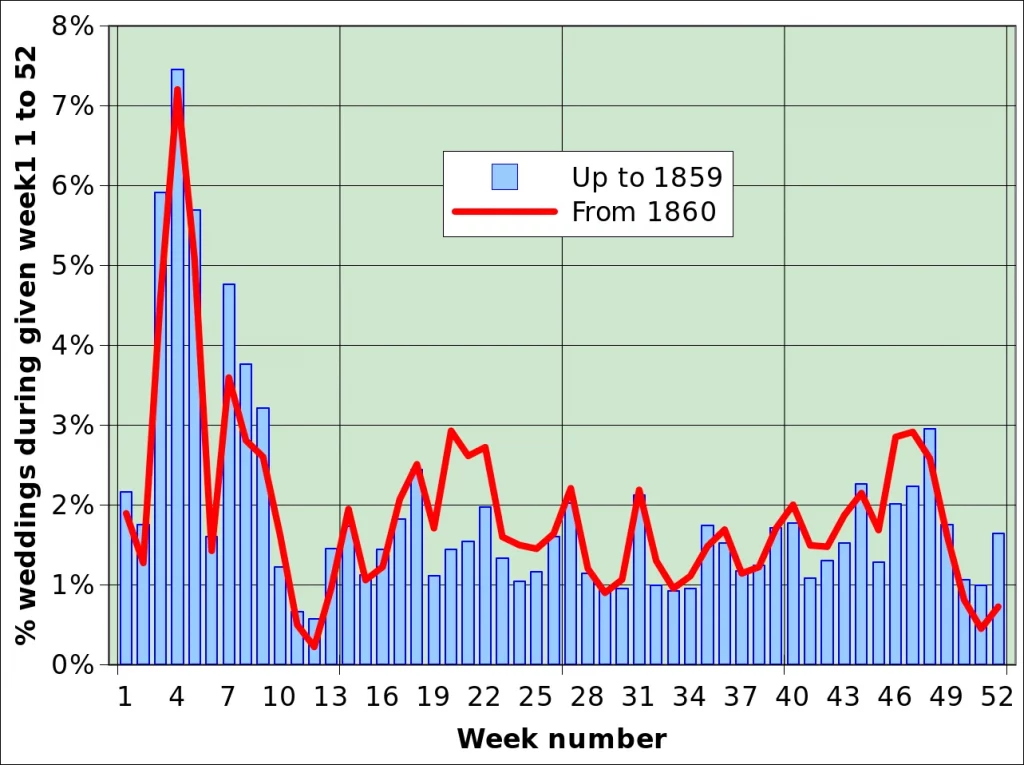
As illustrated in figure WEDWEEK-F01 there is a marked peak of weddings at the beginning of the year, from week 3 to week 9 (mid January to the end of February), peaking at week 4, which is the last but one at the end of January. The absolute minimum is during the first week of spring (week 12).
Values thereafter remain relatively stable throughout the year, with minor peaks, apparently at the end of each month. A secondary peak occurs from weeks 44 to 49, i.e. November with the adjacent week in October and December. The graph shows some changes in the period up to 1859 and the subsequent years from 1860 to 1935: the winter peak grows narrower, with a relative reduction from the middle to the end of February and the development of a new peak in May (weeks 19 to 22).
There is little doubt that the described timing is related to the agricultural seasons, with the winter low being a good time for weddings. A secondary determinant is probably religious with the peak just before lent (Fastenzeit) during which the decrease is constant until reaching the easter period. There is a parallel, though lest marked, increase just before the Advent which, like lent, is a period of decreasing frequency of weddings. This may be part of the explanation of the increase in numbers of weddings after Christmas.
The minimum at week 6 coincides with the earliest occurrence of Ash Wednesday (Aschermittwoch) and the beginning of lent (Fastenzeit). The minimum at week 12 is somewhat puzzling. It corresponds approximately with the celebration of the Presentation of Jesus (Darstellung des Herrn or, more frequenly in the region: Mariä Lichtmess or simply Lichtmess) which occurs 40 days after Christmas.
WEDWEEK-2 Average wedding date variations by Cluster
The Clusters are groups of Registry offices which appear to be “similar” based on a number of variables defined in Chapter TYPOL. The current section examines whether the preferences in terms of wedding dates are somehow variable between the clusters.
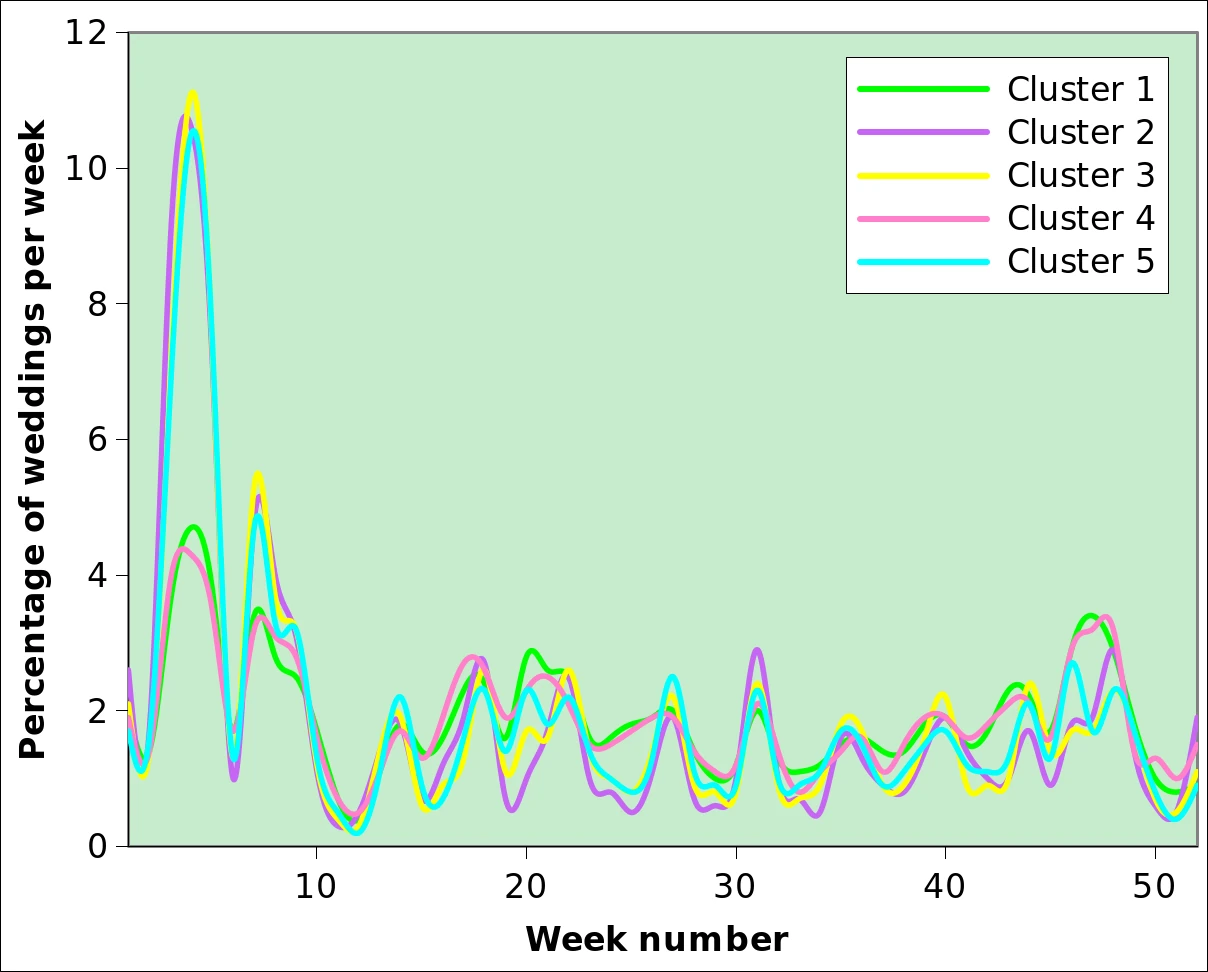 | 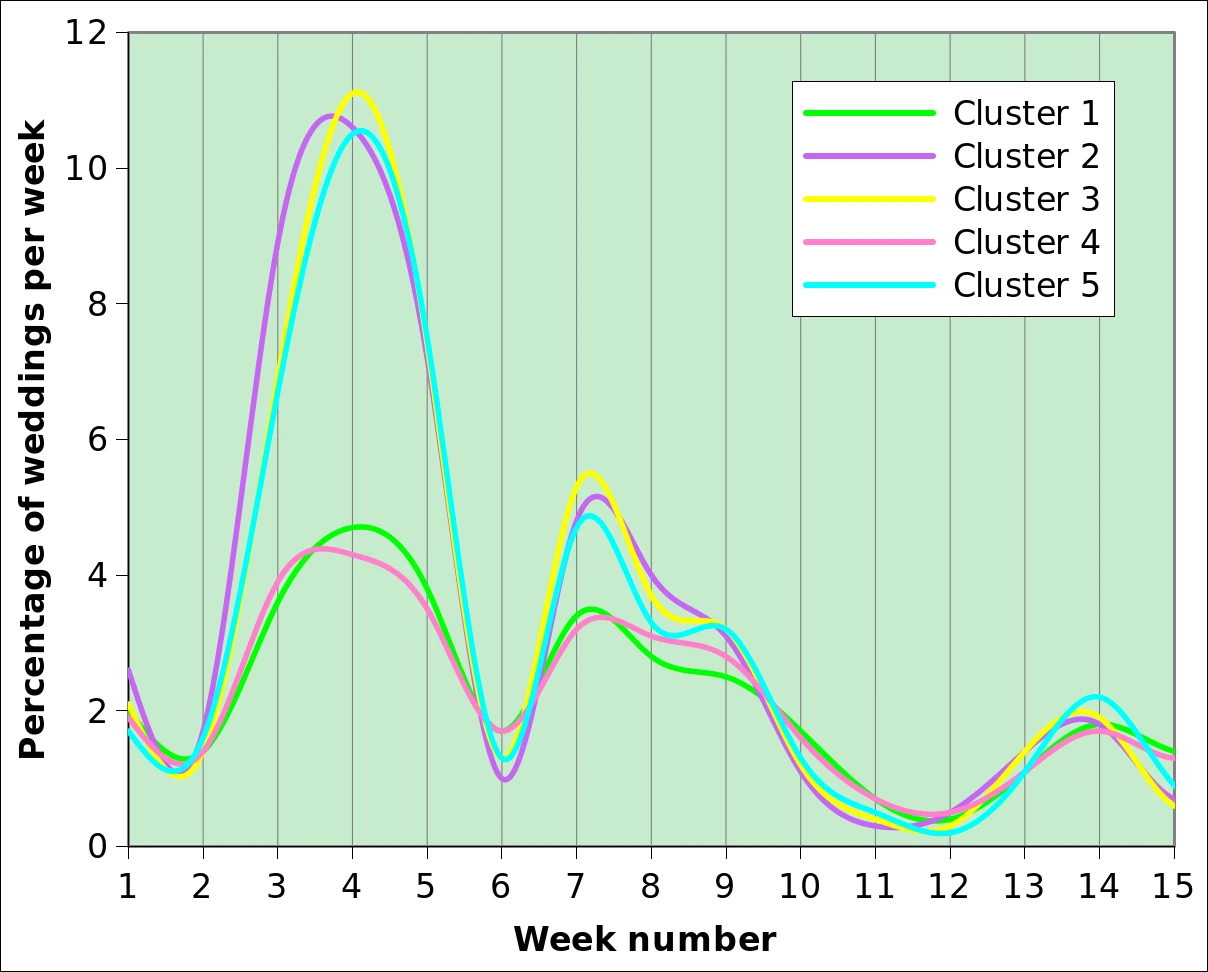 |
During the reference period from 1800 to 1935, the number of weddings amounts to 25350, 2417, 14229, 7837 and 9112, respectively, for clusters 1 to 5. There is relatively little difference between clusters during most of the year. However, there are some clear differences during the “intense wedding period” of January when clusters 2, 3 and 5, i.e. the southern clusters, show about 30% of their weddings, with more than 10% in just one week (week 4, around 24 January) . The same relative behaviour is observed during weeks 7 and 8, mid to late February. The enigmatic drop in week 6 is very visible with identical percentages across all clusters. The total percentage of weddings that take place during weeks 1 to 11 is between 42% and 46% for clusters 2, 3 and 5, and 28% for both clusters 1 and 4.
The low values at the beginning of the year in clusters 1 and 4 are compensated by slightly higher values throughout the year, and markedly higher during weeks 25 (late June) as well as 44 to 48 (late October and much of November).
WEDWEEK-3 Average wedding date variations by period
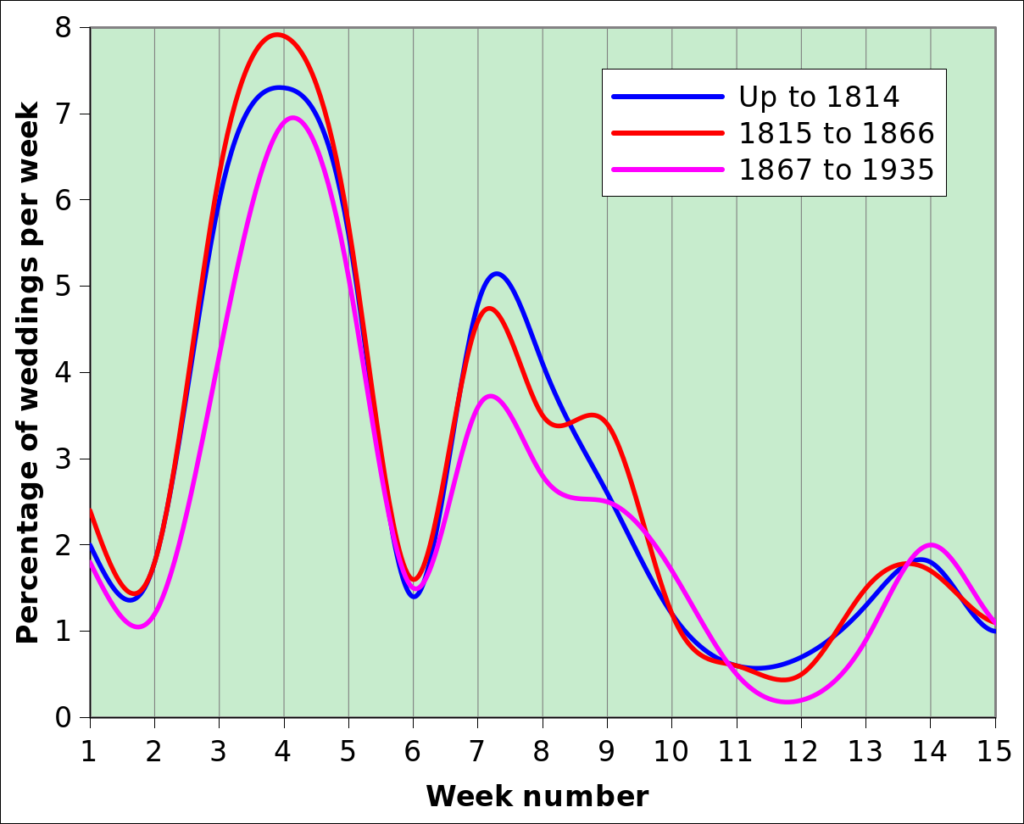
Figure WEDWEEK-F04 shows the frequency of weddings over historically meaningful periods as described in chapter HIST. The figure showing all weeks up to 52 was omitted as it shows a behaviour that is basically identical to the one shown in WEDWEEK-F021, i.e. a long tail of low values with apparently random fluctuations.
The total number of weddings in period 1 (Up to 1814) is 5474 and 22067 and 3104, respectively, during the two subsequent periods. Between 30 and 40% of the weddings took place in the period between the beginning of the year and mid March, i.e. substantially in winter (weeks 1 to 11), as already mentioned. The actual percentage for the three periods is 37, 39 and 32, showing a decrease compared with earlier periods during the Empire and the Weimar republic.
WEDWEEK-4 Average wedding variations by Cluster and period
Another way to look at the data is to plot average annual wedding date by year, as shown in figure WEDWEEK-F05. If weddings were equally distributed over the year, the expected average would be 26.5, i.e. (1+52)/2. A concentration of weddings at the beginning of the year shifts the average to lower values. Some within-year information is lost compared with the previous figures, but the representation can show Cluster information together with variations over time.
Note that WEDWEEK-F05 shows 7-year moving averages. An example showing the actual points in addition to the moving averages as well as trends for clusters 1 and 5 can be seen by clicking this link.
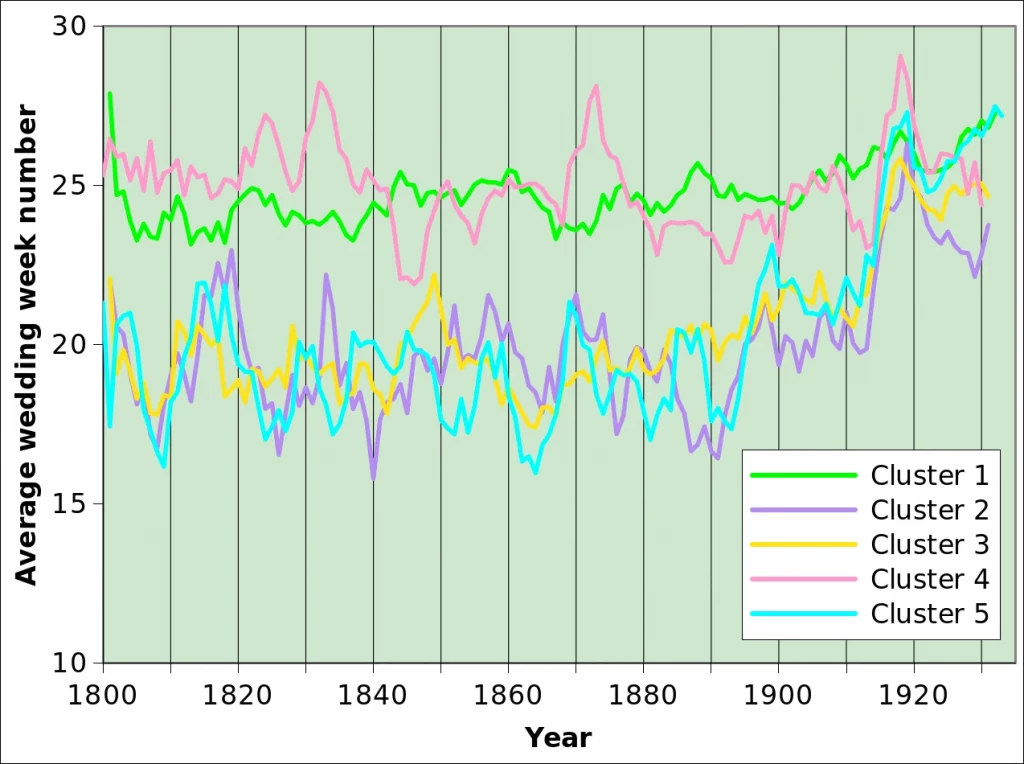
WEDWEEK-F05 shows stable values close to 25 for for Clusters 1 and 4, with particularly stable values in Cluster 1, eastern Vulkaneifel district. Values in the south, i.e. the Moselle valley (Clusters 2,3, and 5) show much lower values indicating a larger share of winter weddings, as already shown in figure WEDWEEK-F03. One of the most interesting features of WEDWEEK-F05 is the marked upward trend that took place from about 1891 (Refer to table WEDWEEK-T01). The flattening of the year-wide frequency of weddings curve was such that it reached values similar to those in the northern areas. This coincides precisely with first world war (1914 to 1918) and illustrates how an external constraint uniformised bridal behaviour and temporarily suspended local traditions.
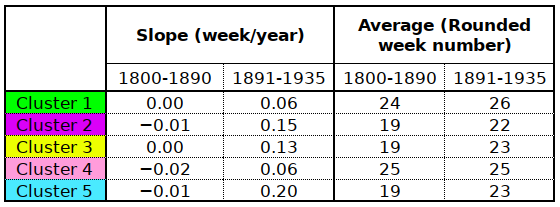
Table WEDWEEK-T01 shows low and even slightly negative trends (i.e. slopes) in average wedding week number before 1891, which is to say that nothing basically changed. From 1891, however, all trends turn positive: weakly so in the Volcanic Eifel (Clusters 1 and 4) but more strongly in the Moselle valley. As a result, weddings occur later that in the previous period, by up to 4 weeks (Clusters 3 and 5).
After the war, clusters 2 and 4 world seem to decrease and possibly return to the pre-1891 stability, and week numbers for clusters 1 and 5 apparently continue raising. The series is, however, too short for trends to be conclusive.
WEDWEEK-Appendix: correspondence between seasons, weeks numbers, dates and main catholic celebrations
- To avoid some tricky arithmetic, similar to computing average time on a 24 hour clock, or average wind direction[↩]