LUCLIM.1 Population and land use according to the the 1885 census
The table below was assembled based on the data contained in the 1885 census of the German empire. All the district offices where the weddings were recorded (Standesamtbezirk) belong to the Government districts (Regierungsbezirk) of Koblenz or Trier. The names of the counties (Kreis) have changed slightly, with the county of Daun being now Vulkaneifel. All the data were extracted from the 1885 census, published in 18881. The relevant pages are available from the Project’ s DATA chapter.
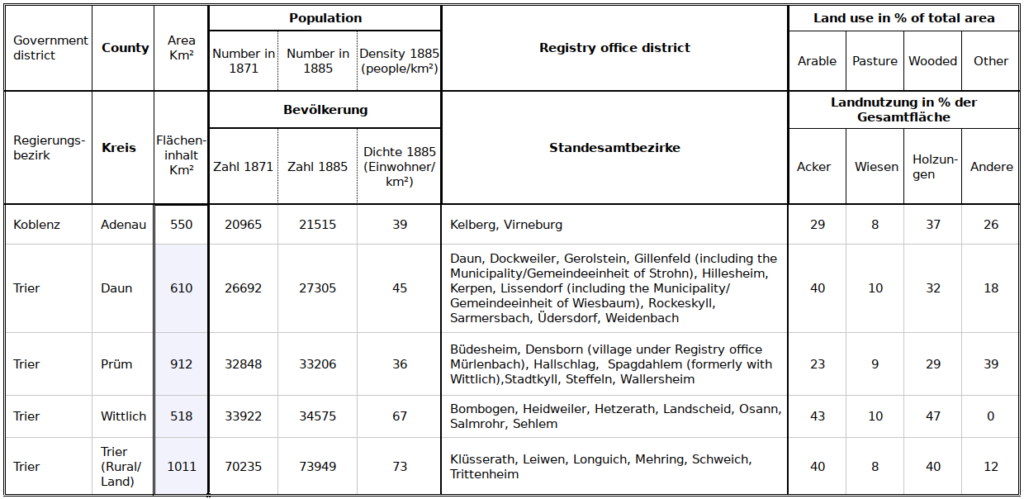
The main characteristics of the Project area above at County level: the listed values correspond to the whole counties and not specifically to the listed Registry offices districts. While for Daun the whole Kreis is included (all the registry offices are covered), the coverage is only partial for the other counties, especially Adenau where only two Registry offices are included.
The data describe a sparsely populated rural region where agricultural land makes up about 50% of the area, and woodlands cover about a third. As will be seen in subsequent sections, the population is vulnerable to weather vagaries as they impact agriculture.
Population density in southern Trier Government district (Counties of Wittlich and Trier-rural) is close to double the values in the northern Kreise where elevation is close to, or above 500 m. In the south (Moselle valley; refer to first figure above) the elevation mostly does not exceed 250 m.
All the raw data used in this section were downloaded from the German Weather Service DWD and then processed as explained. Definitions are explained in the ad hoc page of DWD. In addition to the Project Hull, data are also provided for the “Climatic square” or “Square” which is a rectangle2 delimited by the longitudes 6.0 to 7.5 and latitudes 49.5 to 50.53. The Climatic square will be resorted to frequently in later sections (e.g. chapter VARENV)
LUCLIM.2 1961-1990 Climate
The two maps below show average annual precipitation and temperature between 1961 and 1990. This 30-year period is the previous “standard normal” 4.
The average elevations of the Hull and the Square are almost identical (394 Vs. 396) while the County of the Volcanic Eifel reaches 486 m and the historic Rhineland averages to 256 m.
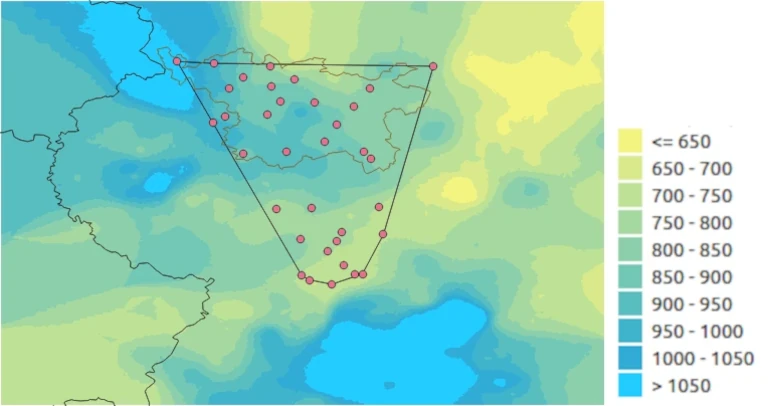
The map shows average annual precipitation over the Climatic square. Highest values occur in the northern half of the Hull, with values in excess of 1000 mm at Hallschlag, which also corresponds to the highest elevation. Values stay high moving south-East to Densborn (867 mm), Weidenbach (915 mm) and Dockweiler (863 mm) but decrease south of Spangdahlem (779 mm), Landscheid (819 mm) and Bombogen (750 mm) to rteach their lowest values in Longuich (715 mm) and Mehring (716 mm) in the valley of the Moselle.
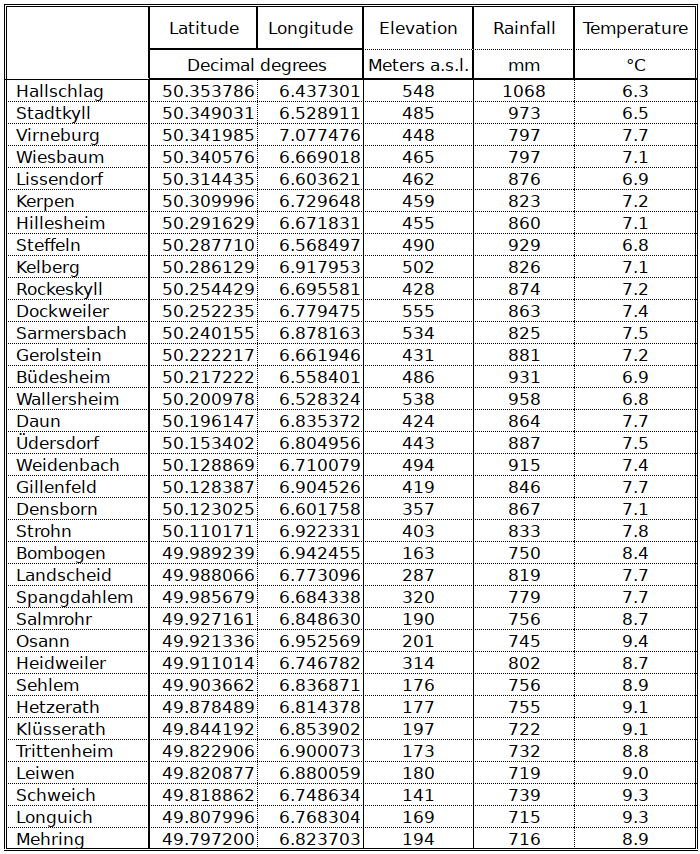
Coordinates, annual rainfall and Temperature are given for all the Localities in the Project in the next table:
Average annual values rainfall and other variables are provided for the whole area in the table below, after the temperature map, and closely reflect the elevation pattern for both rainfall and temperature.
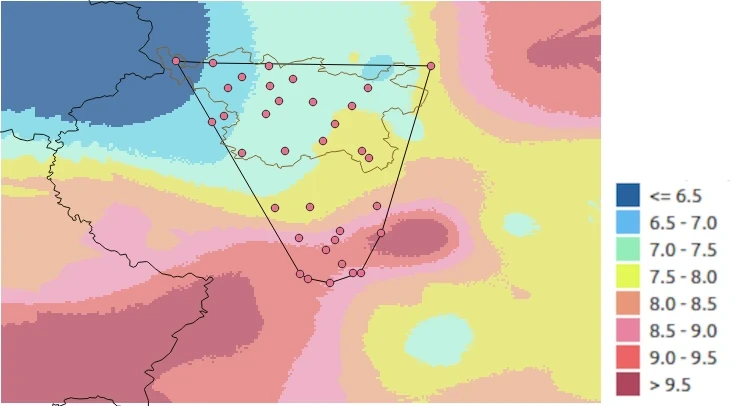
The average annual temperature map reflects the elevation pattern more closely than the rainfall map, with a drop in temperature of 0.5 degrees every 100 m increase in elevation, e.g. from 9.4°C in Osann (SE Hull in the Moselle valley) to 6.3°C in Hallschlag.
Seasonal data are provided by the table below. Seasonal maps were prepared for rainfall and temperature but the patterns are essentially zonal and elevation-dependent and, as such, provide little useful information. The table includes ice, frost, summer and hot days (as defined by DWD) , as well as hours of bright sunshine, a major determinant of agricultural production. Another one is snow cover, which protects winter crops from extreme cold and “winter kill”. However, at the time of writing, usable snow data have yet to be located (or indirectly derived)5.
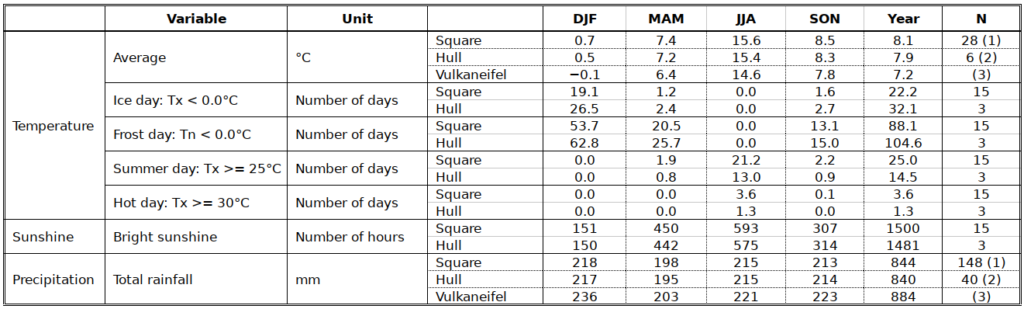
Average annual temperatures are surprisingly close to the SON. Frost days may occur in MAM (late frost) and SON (early frost), which both potentially create difficulties for agriculture. Freezing temperatures are absent only for the summer, JJA and “hot days” are surprisingly rare (just a couple of days over three months). Bright sunshine is concentrated in spring and summer. Finally, rainfall is equally distributed between the season: the Eifel climate is a climate where “it rains every day”.
- Gemeindelexikon für das Königreich Preußen. Auf Grund der Materialien der Volkszählung vom 1. Dezember 1885 und anderer amtlicher Quellen bearbeitet vom Königlichen Statistischen Bureau. XII. Provinz Rheinland. Berlin SW: 1888. Verlag des Königlichen Statistischen Bureaus.[↩]
- Technically, a square is a rectangle![↩]
- At higher latitudes, the length of one degree of a meridian becomes shorter and shorter, to eventually reach 0 km at the pole. Therefore, the actual size of the climatic square is 107 km E-W and 112 km N-S[↩]
- In climatological terms, a normal is the average over a 30-year period; a standard normal is a mostly “pre-climate-change” concept and refers to standard periods including 1931-1990, 1961-1990, 1991-2020. The concept of “normal” assumes that climate is stationary, i.e. that there is no time trend. However, the recent years have all been affected by a steep warming trend – among others – so that they are of limited value to describe climate for the purpose of this “historical” study. We assume that the climate patterns from 1800 are reasonably described by the 1961-1990 period[↩]
- Ice days may come close, as they are days on which no snowmelt should normally not occur, but snow takes time to melt, so that even frost days may preserve snow for some time[↩]